By Lindsey Kundel, Editor in Chief, InGenius Prep

I. Introduction: The New Map of Global Student Mobility
Three years after the world reopened, international student mobility is no longer “recovering.” It’s reorganizing itself.
If you look only at the headlines — record numbers of Indian students, reports of Chinese stabilization, the U.S. surpassing pre-pandemic enrollment — you might think we’re back to business as usual. But the deeper story is more complex, and far more interesting. The 2022–2023 and 2023–2024 cycles are not simply a return to the old equilibrium. They mark the beginning of a new one.
Open Doors shows that new international student enrollment has now risen for three consecutive years, climbing another 14% in 2022–23 after an extraordinary +80% rebound the year before. SEVIS confirms the scale: the United States hosted 1.50 million active F-1 and M-1 students in 2023, a 10.4% increase and the largest number since 2019. Every region of the country — Northeast, South, Midwest, and West — saw growth.
But underneath these national totals lies a sharp divergence. Some regions of the world are accelerating. Others are stabilizing. Still others are slowly slipping away. And as domestic U.S. enrollment continues its decade-long decline, these global shifts matter more to universities than ever.
This synthesis brings together the full Global Matriculation Analysis series — twelve individual regional studies, Open Doors Fast Facts, SEVIS 2023, EducationData.org trends, and state-level demographic data — to offer a single question:
What actually changed in global student mobility between 2022 and 2024, and what does it mean for families, counselors, and universities?
Across all sources, ten themes emerged — the clearest, most consequential signals in a noisy landscape. Together, they redraw the global map of who is coming to the U.S., why they are coming, and how institutions need to respond.
II. The Ten Global Takeaways That Define This Era
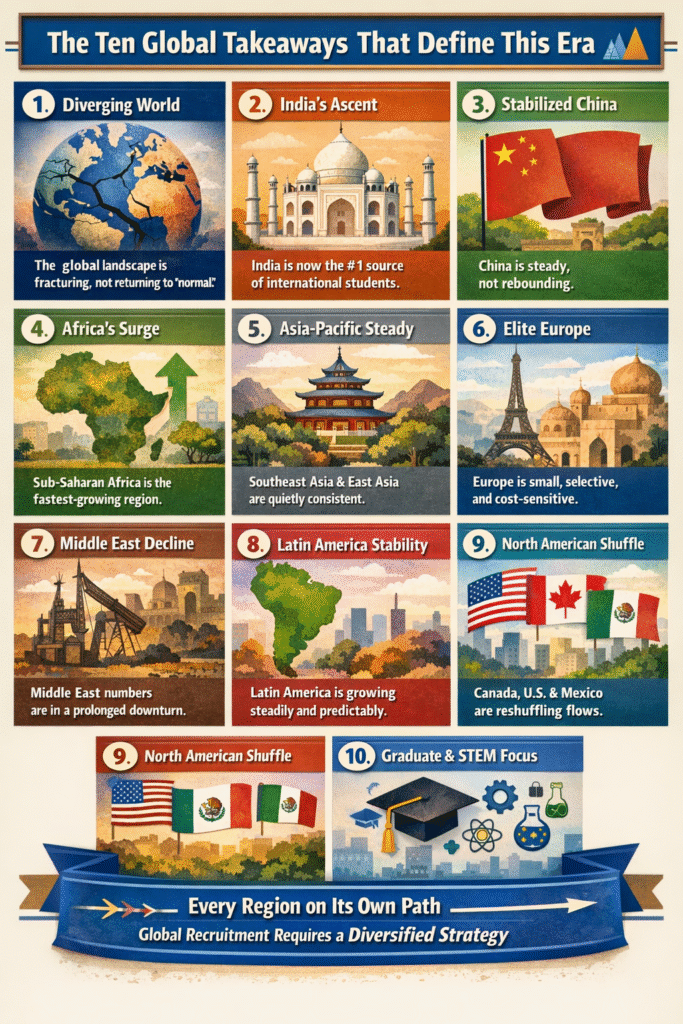
1. The world is not “coming back.” It’s diverging.
The easiest mistake right now is to assume that rising numbers mean the global system has “returned to normal.” The opposite is true. The total is increasing — but the composition is fracturing.
Open Doors confirms that new international enrollment now exceeds pre-pandemic levels, and SEVIS shows double-digit growth in active students between 2022 and 2023. But the source countries fueling that growth could not be more different from a decade ago.
- India is growing at an historic scale.
- China has stabilized — but not rebounded.
- Sub-Saharan Africa is rising faster than any other region in the world.
- Southeast Asia and parts of East Asia are quietly sustaining the system.
- Europe is steady but small and increasingly price-sensitive.
- The Middle East is not returning to its pre-2016 strength.
- Latin America is re-emerging with stability rather than volatility.
Every region is on its own trajectory — some driven by demographics, some by economics, some by policy choices in the U.S., Canada, UK, and Australia.
The implication is clear:
Global recruitment strategy can no longer be built around a single region or a single “big bet.”
2. India has reshaped the global hierarchy — and the change is irreversible.
India is not just growing; it is structurally transforming the U.S. international student landscape.
SEVIS 2023 shows +27.1% growth year-over-year, adding an unprecedented +80,469 new active students — the largest single-year increase ever recorded for any country in U.S. data history. India now leads the world with 377,620 active students, surpassing China across both graduate and undergraduate levels.
Even more important is the type of growth:
- The surge is graduate-driven. Nationally, international master’s enrollment grew 20% in 2023.
- Indian students dominate STEM fields, AI, computer science, engineering, and business analytics.
- India also leads STEM OPT, reflecting strong alignment with U.S. labor shortages and tech-sector demand.
Unlike the earlier China-driven era, India’s surge is not concentrated in a small number of elite institutions. It is spread across large public research universities, urban private institutions, and STEM-oriented campuses in Texas, California, New York, and the Midwest.
This shift has two essential consequences:
- The U.S. international pipeline is now anchored in South Asia rather than East Asia.
- Institutions without a strong graduate STEM ecosystem are losing ground.
India’s rise is not a temporary spike. It is the new baseline.
3. China is stabilizing — neither collapsing nor recovering.
For two years, Chinese enrollment declined sharply. In 2023, that trend broke. SEVIS shows +1.9% growth (+6,169 students) — small, but significant — proof that Chinese families still see the U.S. as a viable option even amid geopolitical tension.
But “stabilization” is not the same as “recovery.”
- New Chinese undergraduate enrollment remains below pre-2019 levels.
- Families are more cautious, more cost-sensitive, and more likely to choose institutions with strong research reputations and clear safety assurances.
- Growth is concentrated in California, New York, and a band of R1 universities with deep research infrastructure.
The China story is best described as redistribution, not resurgence:
fewer students at second-tier regional campuses, more at selective publics and private R1s.
This pattern will likely continue — modest growth, high concentration, and intense competition for the families still planning to send students abroad.
4. Africa is the fastest-growing region in the world — and the growth is structural.
Open Doors 2023–24 shows +13.1% year-over-year growth in Sub-Saharan Africa — the highest of any region. Ghana alone jumped +45% in a single year.
But the real story is not the spike. It’s the structure beneath it:
- Sub-Saharan Africa has the lowest tertiary enrollment rate on earth (~9%), creating an enormous seat deficit at home.
- Youth populations are rising sharply across West, East, and Southern Africa.
- Families view international education as a pathway to employability, not prestige.
- Canada and the UK narrowed work pathways in 2024–25, pushing more students to reconsider the U.S.
Unlike the Middle East’s decline, Africa’s growth is demographic, economic, and long-term. For U.S. institutions, Africa is not a “pilot market.” It is a decade-scale opportunity.
5. Asia-Pacific “silent stabilizers” kept the system from swinging too far.
While attention focused on China’s slowdown and India’s surge, the Asia-Pacific region quietly did the work of stabilizing U.S. enrollment.
Together, Korea, Vietnam, Taiwan, Indonesia, Thailand, Malaysia, the Philippines, and Singapore account for nearly 300,000 international students — a quarter of all international enrollment in the U.S.
Their behavior is remarkably consistent:
- Moderate year-over-year growth
- High English proficiency
- Clear orientation toward ROI, career pathways, and safety
- Significant trust in U.S. community college → transfer models (Vietnam, Indonesia)
These students do not generate headlines — which is precisely why institutions underestimate them. They are the backbone that prevents extreme volatility when China dips or India surges.
6. Europe is small but academically elite — and increasingly two-directional.
Europe sends about 85,000 students to the U.S., roughly 8% of the total. That number has barely changed in a decade, but the composition is shifting:
- Slight growth from Eastern Europe and Türkiye
- Flat or declining numbers from Western Europe
- Rising concerns about cost and transparency
- Increasing preference for shorter UK or EU bachelor’s programs
The most interesting trend is the mirror effect:
More American students than ever are applying to study in the UK and EU — a reflection of the same cost-value calculus European families apply to the U.S.
Europe remains a prestige + fit market, not a volume market.
7. Middle East enrollment has not recovered — and may be entering a long-term reset.
For more than a decade, the Middle East was one of the most reliable sources of international students for U.S. universities. No country symbolized that era more than Saudi Arabia, whose King Abdullah Scholarship Program once sent more than 60,000 students annually. That peak is long gone. Today, Saudi active enrollment sits closer to 22,000, and the broader region shows similar patterns.
What’s striking in the 2023 data is not just the lack of recovery — it’s the consistency of decline.
Most countries in the region are either flat or slightly down from last year, and no structural forces suggest a return to 2015–2016 volumes.
Three factors define the Middle East’s new trajectory:
- Government scholarship contraction — Saudi Arabia, Kuwait, and Qatar have strategically redirected funding to local universities.
- Immigration optics — families cite perceived U.S. visa risk and shifting political rhetoric as persistent barriers.
- Emerging regional hubs — the UAE, Saudi Arabia, and Qatar have expanded their own university ecosystems, diminishing the necessity of study abroad.
This region will continue to send strong students — especially in engineering and business — but the overall share of global mobility is shrinking. Unlike the cyclical patterns seen in East Asia, the Middle East’s decline appears to be a structural realignment, not a temporary dip.
8. Latin America is entering a phase of steady, predictable growth — not volatility.
Latin America and the Caribbean often get lumped together as “emerging” markets, but the post-pandemic data tells a different story. This is one of the most stable regions for U.S. international enrollment — and in some countries, the recovery is stronger than expected.
SEVIS 2023 shows:
- Brazil is now a top-five sender with 41,703 active students, the highest in its recorded history.
- Mexico, while fluctuating by economic cycle, maintains a consistent ~23,000 active students.
- Colombia, Peru, and Chile are steadily rebuilding pipelines that dipped during COVID.
But the bigger story is predictability: Latin American trends correlate closely with currency cycles, scholarship opportunities, and proximity — making the region’s year-over-year movement more forecastable than Africa, the Middle East, or even China.
Families in Central and South America increasingly prioritize:
- Transparent pricing
- 2+2 community college pathways
- Safety and housing guarantees
- U.S. bilingual environments (Miami, Texas, California)
- Outcomes over rankings
These families are not chasing prestige; they are chasing stability, employability, and cultural alignment. For U.S. institutions — especially those outside the coasts — Latin America is becoming a reliable long-term recruitment base.
9. North America is experiencing intra-regional shuffling — with global implications.
One of the least discussed but most consequential shifts is happening within North America itself.
The U.S., Canada, and Mexico no longer operate as three independent systems. Policy changes in one country now immediately influence the flows to the others — and internal migration within the U.S. is creating new patterns of opportunity and risk.
Canada → U.S.
Canada’s 2024–2025 tightening (higher financial thresholds, dependents ban for many graduate programs, and caps on international permits) fundamentally altered global perception.
Families from India, Nigeria, Vietnam, and the Philippines — once the backbone of Canadian growth — are now reassessing the U.S. as the more predictable long-term option, especially for graduate STEM pathways.
Mexico → U.S.
Cross-border mobility remains unusually high.
Every day, thousands of Mexican and U.S. dual residents cross between Baja/California, Sonora/Arizona, and Chihuahua/Texas for K–12 and community college programs. These flows stabilize U.S. enrollment in border states and reinforce 2+2 transfer pipelines.
Internal U.S. Redistribution
SEVIS shows that while all U.S. regions grew in 2023, the pattern was uneven:
- California continues to lead with 237,594 international students (15.8% of the national total).
- Texas, Florida, Arizona, and Massachusetts posted some of the fastest growth.
- Midwestern and Southern publics increasingly depend on global recruitment to offset domestic enrollment decline.
- Smaller Northeastern privates show the sharpest vulnerability when China stabilizes rather than grows.
Implications for global recruitment:
North America’s internal shifts directly affect where universities look outward. When Texas and Florida campuses reach capacity, they expand abroad more selectively. When small Northeastern campuses lose Chinese undergraduates, they intensify outreach in Vietnam, Brazil, and West Africa.
In other words:
the North American market is now a feedback loop — domestic trends shape global priorities, and global constraints reshape domestic strategies.
10. The U.S. international pipeline is now graduate-driven, OPT-dependent, and STEM-centric.
Across every dataset, the same three forces appear repeatedly.
1. Graduate education is driving the system.
SEVIS degree distribution in 2023:
- Master’s: 45% (608,857 students)
- Doctoral: 15.3% (206,433)
- Bachelor’s: 33.8% (457,906)
- Associate: 5.9% (79,648)
Master’s enrollment grew 20% year-over-year, far outpacing all other degree levels.
This helps explain India’s rise and China’s stabilization.
2. OPT is the United States’ single largest competitive advantage.
- 160,627 active OPT students in 2023
- 122,101 in STEM OPT
- 39.1% Indian
- 23.7% Chinese
- 39.1% Indian
Without OPT — and especially STEM OPT — the U.S. would lose a defining appeal: a pathway from education to work experience to long-term visas. Families from Africa, APAC, and South Asia consistently describe OPT as the deciding factor.
3. Majors increasingly cluster in STEM + business analytics.
Top SEVIS majors in 2023:
- Computer Science — 108,438
- Second Language Learning — 99,721
- Business Administration — 86,235
- CIS — 78,408
- Electrical Engineering — 37,322
- Data/Quantitative fields — 27,000+ each
The U.S. is no longer attracting a balanced distribution of global students; it is attracting a workforce pipeline shaped by AI, engineering, computing, and data science.
The shift is unmistakable:
U.S. international education is now structurally tied to employability.
And institutions without clear pathways into high-demand fields — or without robust career services — are losing market share.
III. Gender Dynamics: The Hidden Story in Global Mobility
One of the clearest — yet most overlooked — patterns in the 2023 SEVIS data is gender. While institutions often segment recruitment by region, major, and degree level, very few look at the gender composition of their international student body. The data tells us they should.

The global picture
In 2023, the active F-1 and M-1 international student population was:
- 44.5% female (668,771)
- 55.5% male (834,111)
This imbalance has existed for years, but it widened during the post-pandemic period. And the discrepancy becomes even clearer when we break it down by degree type.
By academic level
- Associate degrees: 49.9% female
- Bachelor’s + Master’s: 44% female
- Doctoral: 41.3% female
The progression is unmistakable: the higher the degree level — especially in STEM-heavy doctoral programs — the more male the international population becomes.
By country, the contrasts are stark
Across the top 10 sending countries in 2023:
| Country | Female % | Male % | Interpretation |
| India | 38% | 62% | Driven by tech/STEM graduate programs; male-dominated pipeline |
| China | 48% | 52% | Nearly gender-balanced; stronger female representation in business, humanities, social sciences |
| South Korea | 48% | 52% | Consistent balance across bachelor’s and master’s |
| Canada | 49% | 51% | Very close to parity |
| Brazil | 56% female | 44% | The only major sender with a female-majority pipeline |
| Vietnam | 53% | 47% | Strong female participation in business and STEM-transfer pathways |
| Japan | 52% | 48% | Balanced, with slight female majority |
| Taiwan | 48% | 52% | Consistent across degree levels |
| Nigeria | 45% | 55% | Strong male skew in engineering, business, and tech fields |
| Mexico | 48% | 52% | Mixed, but stable |
What this means — and why it matters now
This is not a superficial demographic detail. Gender shapes:
- Major selection (India’s male-heavy representation mirrors its engineering/CS concentration)
- Support needs (housing, safety, mentorship, community networks)
- Career outcomes (female students report different types of visa and employability concerns)
- Scholarship and recruitment strategy
- Classroom and campus culture
And yet, most U.S. institutions do not address gender directly in their recruitment materials, their yield communications, or their student support infrastructure.
A few key patterns emerge:
1. India’s surge is changing the gender composition of U.S. campuses.
Because India’s rise is concentrated in engineering, CS, AI, and business analytics, the national gender split is slowly tilting more male. Institutions with large Indian graduate populations are feeling this most acutely.
2. Latin America and Southeast Asia bring balance.
Brazil, Vietnam, and parts of Southeast Asia send higher proportions of female students — many entering health sciences, business, education, and community college transfer pathways.
3. Doctoral programs remain stubbornly male-heavy.
Despite progress in some disciplines, international doctoral engineering and computer science programs skew significantly male, with downstream implications for faculty pipelines.
4. Gender intersects with safety and belonging.
Female students — particularly from Latin America, East Asia, and the Middle East — routinely cite concerns about:
- off-campus housing,
- transportation,
- institutional responses to harassment,
- and the availability of women-led mentorship.
These concerns influence not only enrollment but persistence and satisfaction.
The broader takeaway:
Gender is not a trivial demographic footnote. It’s a strategic lens that reveals who feels welcome, who feels prepared, and where institutions need to invest to support a changing global population.
IV. Cross-Regional Interactions: How One Market Shapes Another
One of the most revealing patterns emerging from the 2022–2024 cycle is that no region exists in isolation anymore. International mobility has become a set of interlocking systems, where policy changes, demographic shifts, or economic pressures in one country instantly ripple into others. The result is a global market that behaves less like a map of independent flows and more like a network of connected currents — each pushing or pulling against the next.

Across the full dataset, three kinds of cross-regional interactions stand out:
1. When one major destination tightens, another rises.
This dynamic is clearest in the way the U.S., Canada, the UK, and Australia now influence each other.
Canada’s 2024–2025 restrictions → U.S. gains in Africa + South Asia + Southeast Asia.
When Canada raised financial thresholds, restricted dependents, and introduced caps on international study permits, families reconsidered their long-term strategy. This is especially true for:
- Indian graduate students
- Nigerian and Ghanaian undergraduates
- Vietnamese and Filipino applicants
- Master’s-level STEM fields
These were the same groups that had fueled Canada’s meteoric rise between 2017 and 2023 — and their pivot back toward the U.S. shows up in early 2024–2025 counseling inquiries and SEVIS new-record trends.
UK dependents ban (2024) → U.S. gains among graduate students with families.
The UK’s decision to prohibit most international master’s students from bringing dependents immediately reduced its appeal for:
- Indian families
- Nigerian and Ghanaian families
- Middle Eastern families
- Mature applicants shifting careers
The U.S., with OPT and clearer multi-year pathways, quietly inherited a portion of that demand.
Australia’s higher English requirements + visa tightening → U.S. rebound from Vietnam + Indonesia + Nepal.
Australia’s policy changes dampened momentum from several APAC countries. U.S. community-college pathways — especially in Washington, California, Arizona, and Texas — saw increased interest as a result.
Core dynamic:
The “big four” destinations (U.S., Canada, UK, Australia) now behave like communicating vessels.
Lower opportunity in one increases demand in another.
2. As China stabilizes, Southeast Asia and South Asia expand to fill capacity.
With Chinese undergraduate enrollment flat, many institutions — especially in the Midwest and South — have sought to diversify. The results show up clearly:
- Vietnam continues its consistent multi-year rise, fueled by strong English proficiency and transfer pipelines.
- India fills graduate-level capacity gaps everywhere from Texas to New Jersey.
- Indonesia, Thailand, Malaysia grow steadily where institutions invest in regional partnerships.
- Bangladesh and Nepal appear in more institutional new record lists than ever before.
This diversification is not accidental. It reflects:
- Strategic pivoting from enrollment offices
- Government visa changes abroad
- Work-rights clarity in the U.S.
- Highly price-sensitive families seeking predictable pathways
The effect is a new geographic balance: China still matters enormously, but it no longer defines the entire system.
3. North America’s internal movement reshapes global strategy.
As discussed earlier, the U.S., Canada, and Mexico now form an integrated mobility ecosystem. But the consequences go beyond their borders.
When California and New York reach saturation, recruitment spreads outward.
California hosts 237,594 international students — almost 16% of the national total. Once capacity constraints hit housing and campus staffing, institutions in Washington, Arizona, Utah, Florida, and Texas amplify global outreach to absorb demand.
When small Northeastern privates lose Chinese undergraduates, they turn to Latin America + Southeast Asia.
Your North America analysis showed:
- Brazil as a fast-growing anchor market
- Mexico and Central America are providing predictable pipelines
- Vietnam and the Philippines are filling first-year and transfer seats
- The Caribbean is contributing steady community-college flows
These shifts are already reshaping institutional priorities for 2024–2026.
When Canada tightens, global competition re-intensifies.
Canada’s cap and dependents change did not simply push students to the U.S. — it prompted universities in the U.S. to re-evaluate their own strategies, pricing, and visa-support messaging. The effect cascades:
- Midwest publics are now actively recruiting in Ghana and Kenya.
- Southern institutions are re-entering Colombia and Peru.
- Urban privates in Boston, Chicago, and D.C. are expanding their presence in India, Vietnam, and Indonesia.
Key insight: U.S. institutions don’t just compete with each other. They compete with the policy environments of Canada, the UK, and Australia — and their own domestic capacity constraints.
4. Safety, housing, and political climate ripple across multiple regions simultaneously.
Across East Asia, Southeast Asia, and Europe, the same concerns appear:
- Safety on and near campus
- Off-campus housing shortages
- U.S. political polarization
- Mass media perception of violence
When these concerns spike in one region’s press coverage, they influence adjacent markets.
Example: High-profile safety stories in Korean and Japanese media directly influenced Vietnamese and Thai parent sentiment in 2023–24 — families often share information horizontally within the APAC region, regardless of national borders.
5. OPT is a global lever — and a global vulnerability.
Because OPT and STEM OPT are the U.S.’s strongest competitive advantage, they also represent the most sensitive policy hinge.
- When OPT feels secure → U.S. gains India, Vietnam, Nigeria, Brazil.
- When OPT appears politically vulnerable → U.S. risks losing to Canada and Australia.
Every region in your series echoed this same theme:
Families make decisions based not on four years of tuition, but on six years of opportunity (degree + OPT).
The larger point
The U.S. international education landscape is no longer driven by a single country, a single region, or even U.S. domestic conditions. It is a multi-directional, globally interdependent system.
In this environment, universities that understand cross-regional dynamics — and adapt proactively — will grow. Those that treat each region in isolation will struggle.
V. Institutional Winners & Losers
The SEVIS Top 20 lists from 2022, 2023, and 2024 reveal the clearest evidence of which institutions are thriving in the new global landscape — and which ones are benefiting from shifts in India, China, Africa, Southeast Asia, and Latin America.
Across all three years, the hierarchy is remarkably stable at the top — but the middle of the Top 20 tells the real story of shifting pipelines, changing majors, and evolving institutional strengths.
A. The Winners
1. The “Big Four”: NYU, Northeastern, Columbia, USC
Across 2022 → 2023 → 2024, four institutions tower over all others:
| Rank | 2022 | 2023 | 2024 |
| #1 | NYU – 21,453 | NYU – 24,921 | NYU – 25,617 |
| #2 | Northeastern – 21,385 | Northeastern – 23,711 | Northeastern – 24,968 |
| #3 | Columbia – 20,347 | Columbia – 22,982 | Columbia – 24,042 |
| #4 | USC – 18,437 | USC – 19,985 | USC – 20,562 |
Why they dominate:
- Urban campuses with deep employer ecosystems
- Heavy enrollment in graduate STEM + analytics + business
- High OPT/CPT conversion
- Strong career pipelines
- Large international alumni networks
- Housing availability through metro rentals rather than limited dorm stock
What’s notable:
NYU and Northeastern have become the two largest international hosts in U.S. history — neither of which are Ivy League institutions. This reflects the new reality: students choose outcomes and location, not prestige labels.
2. Rapid Risers: Arizona State, University of North Texas, UT Dallas
Three public institutions show dramatic multi-year growth:
| Institution | 2022 | 2023 | 2024 | Growth (2022–2024) |
| Arizona State University | 15,855 | 17,953 | 20,114 | +4,259 |
| University of North Texas | Not Top 20 in 2022 | 13,082 | 14,213 | New major entrant |
| UT Dallas | 10,155 | 10,929 | 10,773 | Consistent top-tier STEM magnet |
These institutions benefited from:
- Affordable tuition relative to coastal peers
- Large engineering/CS programs
- High Indian and Nigerian graduate enrollment
- Proximity to growing tech hubs (Dallas, Tempe/Phoenix)
- Strong 2+2 and transfer pipelines
ASU in particular is becoming the new-generation version of USC/NYU: a mega-host combining scale, innovation, and location.
3. The Midwestern Anchors: UIUC, Purdue, Wisconsin, Michigan
The Midwest continues to perform exceptionally well:
| Institution | 2022 | 2023 | 2024 |
| UIUC | 15,231 | 16,418 | 17,792 |
| Purdue | 12,389 | 13,033 | 13,568 |
| Wisconsin | 9,053 | 10,240 | 10,997 |
| Michigan | 11,329 | 12,952 | 13,292 |
Why they win:
- Powerful engineering and CS ecosystems
- Industry-aligned research hubs
- Lower cost of living than coastal competitors
- High trust from Chinese, Indian, and Korean families
- Exceptional OPT placement rates
This region is the backbone of the U.S. STEM graduate pipeline.
4. The University of California System: Still a Global Magnet
Six UC campuses appear across the Top 20:
- UC San Diego
- UC Berkeley
- UCLA
- UC Irvine
- UC Davis
Together, UC campuses educate tens of thousands of international students annually.
Their strengths:
- Elite research reputation
- Proximity to California tech and biotech sectors
- Deep alumni networks in China, India, Korea, Taiwan
- Mild climate, strong safety perception
But their challenge is also clear: California is reaching capacity.
Housing constraints will increasingly push students toward Arizona, Texas, Washington, and the Midwest.
5. Ivy League and Elite Privates: Still Strong, But Not the Primary Drivers
Three elite privates feature consistently:
- University of Pennsylvania (9,357 → 11,563 → 12,242)
- Cornell University (new Top 20 entrant in 2023 with 10,249 → 10,895)
- Carnegie Mellon University (9,848 → 10,796 → 11,216)
These institutions maintain robust pipelines due to brand value, research strength, and specialized graduate programs.
But unlike NYU or Northeastern, their growth is steady, not explosive.
Their main competitive advantage remains:
- Elite career outcomes
- PhD/postdoc pipelines
- High-end employer networks
B. The Losers — or the Institutions Losing Ground Relative to the Market
1. Institutions Dropping Out of the Top 20
From 2022 to 2024, the following institutions fell out of the Top 20 list entirely:
- UC Davis
- UC Irvine
- Penn State (only just holds on at #20 in 2024 down from #13 in 2022)
These declines are not collapses — they reflect increased competition from:
- Texas institutions
- Large publics scaling graduate STEM
- ASU’s dramatic expansion
- UNT’s rapid rise
- Cornell’s entrance into the Top 20
Institutional risk factors include:
- Limited graduate engineering/tech capacity
- Housing constraints
- Higher cost-of-living environments
- Lower yield from India and Africa
- Fewer new master’s programs in applied fields
2. Institutions Stagnating Off the List
Several universities that once had strong Chinese or Middle Eastern pipelines remain stagnant outside the Top 20 due to:
- Plateauing Chinese undergraduate demand
- Limited graduate expansion
- Rural or remote locations
- High tuition without ROI clarity
This includes many mid-sized Northeastern privates and regional flagships that previously benefited from China’s 2010–2019 boom.
3. Elite STEM Schools That Underperform in Scale
Institutions such as MIT, Stanford, Duke, Vanderbilt, Georgetown, and Chicago continue to attract extremely strong applicants — but in small numbers relative to enrollment leaders.
Reasons:
- Limited graduate enrollment capacity
- Smaller overall class sizes
- Less structural growth at master’s level
- High-cost metro housing (Stanford, MIT)
Their yield remains high among admitted students, but their overall market share is limited.
C. Structural Patterns Across the Top 20
The three-year comparison shows unmistakable trends:
1. Graduate-heavy institutions are climbing the fastest.
ASU, UNT, UT Dallas, Purdue, Michigan, and UIUC all expanded via master’s and professional STEM programs, capitalizing on India’s surge.
2. Urban universities outperform rural ones.
New York, Boston, Los Angeles, Seattle, Philadelphia, and Chicago dominate the list due to:
- work access
- transportation
- community networks
- global brand awareness
3. Institutions with strong OPT ecosystems rise fastest.
Any university that can reliably convert degrees → internships → employment → STEM OPT gains enormous traction.
4. California is reaching saturation.
UC campuses remain strong but face housing constraints, pushing growth toward Arizona, Texas, Washington, and the Midwest.
5. International enrollment is clustering more tightly at the top.
The top 20 institutions host an increasingly large share of all F-1 students — reflecting global trust consolidation around large, urban, research-intensive universities.
D. What the Top 20 Reveal About the “Winners and Losers” Narrative
When viewed together, the Top 20 provide a map of the institutions best aligned with global demand:
- Scale → large STEM and business programs
- Location → metros dominate
- Price → affordability relative to peer quality
- Outcomes → OPT/CPT infrastructure
- Brand → global familiarity
- Support → safety and housing transparency
Universities lacking these attributes are increasingly losing international market share — regardless of their domestic ranking or prestige.
Table 1. Top 20 U.S. Institutions by Active SEVIS F-1 Higher Education Students (2022)
| Rank | Institution | SEVIS Count (2022) |
| 1 | New York University | 21,453 |
| 2 | Northeastern University | 21,385 |
| 3 | Columbia University in the City of New York | 20,347 |
| 4 | University of Southern California | 18,437 |
| 5 | Arizona State University | 15,855 |
| 6 | University of Illinois Urbana–Champaign | 15,231 |
| 7 | Boston University | 14,150 |
| 8 | Purdue University | 12,389 |
| 9 | University of California San Diego | 12,250 |
| 10 | University of California, Berkeley | 11,489 |
| 11 | University of Michigan | 11,329 |
| 12 | University of Washington | 11,200 |
| 13 | Pennsylvania State University (University Park) | 10,481 |
| 14 | University of Texas at Dallas | 10,155 |
| 15 | University of California, Los Angeles | 10,091 |
| 16 | Carnegie Mellon University | 9,848 |
| 17 | University of Pennsylvania | 9,357 |
| 18 | University of Wisconsin–Madison | 9,053 |
| 19 | University of California, Irvine | 8,964 |
| 20 | University of California, Davis | 8,830 |
Table 2. Top 20 U.S. Institutions by Active SEVIS F-1 Higher Education Students (2023)
| Rank | Institution | SEVIS Count (2023) |
| 1 | New York University | 24,921 |
| 2 | Northeastern University | 23,711 |
| 3 | Columbia University | 22,982 |
| 4 | University of Southern California | 19,985 |
| 5 | Arizona State University | 17,953 |
| 6 | University of Illinois Urbana–Champaign | 16,418 |
| 7 | Boston University | 15,930 |
| 8 | University of North Texas | 13,082 |
| 9 | Purdue University | 13,033 |
| 10 | University of Michigan – Ann Arbor | 12,952 |
| 11 | University of California San Diego | 12,249 |
| 12 | University of California, Berkeley | 12,109 |
| 13 | University of Washington – Seattle | 11,774 |
| 14 | University of Pennsylvania | 11,563 |
| 15 | University of California, Los Angeles | 11,112 |
| 16 | University of Texas at Dallas | 10,929 |
| 17 | Carnegie Mellon University | 10,796 |
| 18 | Pennsylvania State University (University Park) | 10,630 |
| 19 | Cornell University | 10,249 |
| 20 | University of Wisconsin–Madison | 10,240 |
Table 3. Top 20 U.S. Institutions by Active SEVIS F-1 Higher Education Students (2024)
| Rank | Institution | SEVIS Count (2024) |
| 1 | New York University | 25,617 |
| 2 | Northeastern University | 24,968 |
| 3 | Columbia University | 24,042 |
| 4 | University of Southern California | 20,562 |
| 5 | Arizona State University | 20,114 |
| 6 | University of Illinois Urbana–Champaign | 17,792 |
| 7 | Boston University | 15,701 |
| 8 | University of North Texas | 14,213 |
| 9 | Purdue University | 13,568 |
| 10 | University of Michigan – Ann Arbor | 13,292 |
| 11 | University of California San Diego | 12,614 |
| 12 | University of Pennsylvania | 12,242 |
| 13 | University of Washington – Seattle | 11,876 |
| 14 | University of California, Berkeley | 11,809 |
| 15 | Carnegie Mellon University | 11,216 |
| 16 | University of California, Los Angeles | 11,116 |
| 17 | University of Wisconsin–Madison | 10,997 |
| 18 | Cornell University | 10,895 |
| 19 | University of Texas at Dallas | 10,773 |
| 20 | Pennsylvania State University (University Park) | 10,541 |
All Three-Year Trends in One Quick Snapshot
Here’s an additional condensed table to visualize directional movement:
| Institution | 2022 | 2023 | 2024 | 3-Year Trend |
| NYU | 21,453 | 24,921 | 25,617 | ▲ Strong increase |
| Northeastern | 21,385 | 23,711 | 24,968 | ▲ Strong increase |
| Columbia | 20,347 | 22,982 | 24,042 | ▲ Strong increase |
| USC | 18,437 | 19,985 | 20,562 | ▲ Stable increase |
| Arizona State | 15,855 | 17,953 | 20,114 | ▲ Major increase |
| UIUC | 15,231 | 16,418 | 17,792 | ▲ Major increase |
| Boston U | 14,150 | 15,930 | 15,701 | ▲ Slight increase (small dip 2024) |
| North Texas | — | 13,082 | 14,213 | ▲ New entrant, rapid growth |
| Purdue | 12,389 | 13,033 | 13,568 | ▲ Steady increase |
| Michigan | 11,329 | 12,952 | 13,292 | ▲ Steady increase |
| UC San Diego | 12,250 | 12,249 | 12,614 | → Stable |
| UPenn | 9,357 | 11,563 | 12,242 | ▲ Strong increase |
| Washington (Seattle) | 11,200 | 11,774 | 11,876 | ▲ Stable increase |
| UC Berkeley | 11,489 | 12,109 | 11,809 | → Slight dip in 2024 |
| Carnegie Mellon | 9,848 | 10,796 | 11,216 | ▲ Strong increase |
| UCLA | 10,091 | 11,112 | 11,116 | ▲ Stable |
| Wisconsin | 9,053 | 10,240 | 10,997 | ▲ Strong increase |
| Cornell | — | 10,249 | 10,895 | ▲ New entrant, rising |
| UT Dallas | 10,155 | 10,929 | 10,773 | → Stable |
| Penn State | 10,481 | 10,630 | 10,541 | → Flat / slight decline |
Top Risers and Fallers (2022–2024): What the Three-Year SEVIS Data Reveals
Top 5 Biggest Risers (2022 → 2024)
These institutions gained the most international students in absolute numbers and momentum — reflecting strong STEM ecosystems, urban or high-growth regions, and alignment with India/Africa/APAC surges.
1. Arizona State University (+4,259)
15,855 → 20,114
ASU is now one of the fastest-growing global mega-hosts in the country. Its blend of affordability, innovation, online-to-campus pathways, and engineering scale positions it as the new prototype of a global public university.
2. New York University (+4,164)
21,453 → 25,617
NYU remains the largest international host in U.S. history. Its growth is driven not by prestige but by proximity to employers, strong professional programs, and long-standing trust in New York City.
3. Northeastern University (+3,583)
21,385 → 24,968
Northeastern’s ascent shows the long-term payoff of cooperative education, graduate-level expansion, and urban mobility. The university is now the #2 global magnet, rivaling NYU in scale.
4. Columbia University (+3,695)
20,347 → 24,042
Columbia’s professional master’s programs continue to drive its growth. Its increase mirrors strong demand from India and China for business analytics, engineering, and applied sciences — all embedded in a global city.
5. University of Illinois Urbana–Champaign (+2,561)
15,231 → 17,792
UIUC benefits from one of the strongest engineering and CS ecosystems in the world, with exceptional trust among families in China, India, Korea, and Taiwan.
Honorable Mention:
University of North Texas — a major new entrant rising from outside the Top 20 into #8 by 2023–24 (13,082 → 14,213). UNT represents the next wave of Texas-based growth in STEM-heavy institutions.
Top 5 Institutions Losing Relative Market Share
These institutions remain strong but lost ground relative to faster-growing peers — either slipping downward in rank, falling out of the Top 20, or showing flat/declining numbers in a period of global expansion.
1. University of California, Irvine (Dropped Out of Top 20)
8,964 (2022) → Not Top 20 in 2023 or 2024
A strong campus constrained by California housing shortages and limited graduate expansion during a period defined by STEM master’s growth.
2. University of California, Davis (Dropped Out of Top 20)
8,830 (2022) → Not Top 20 afterward
UC Davis remains academically strong, but competition from Texas, Arizona, and Midwest publics — plus statewide capacity limits — appears to have redirected global flows.
3. Pennsylvania State University (Declining Momentum)
10,481 → 10,630 → 10,541
A mild downward trend in a period when peer institutions saw 10–20% growth. PSU’s cost profile and rural location create headwinds as families prioritize ROI and metro access.
4. University of Washington (Slower Growth Than Peers)
11,200 → 11,774 → 11,876
UW is still a powerhouse, but its growth is incremental — overshadowed by the rapid rise of ASU, UNT, Michigan, UIUC, and Texas publics. Seattle housing costs are a limiting factor.
5. Boston University (Plateauing)
14,150 → 15,930 → 15,701
While BU remains a major global host, its numbers flattened in 2024 — likely reflecting Boston’s housing crunch, rising tuition, and a saturated graduate market.
Additional Context:
- Berkeley shows a slight dip (12,109 → 11,809) amid intense Bay Area cost pressures.
- UCLA is stable, but growth is anemic compared to peer publics.
- CMU and Cornell are rising, but at slower rates than the explosive growth of ASU and Northeastern.
Key Insight: Consolidation at the Top
The three-year SEVIS data makes one conclusion clear:
International enrollment is concentrating more tightly in large, urban, research-intensive universities that offer strong graduate STEM programs and clear OPT pathways.
Institutions that cannot offer this combination — especially smaller privates and rural campuses — are losing relative share even when their absolute numbers remain steady.
VI. What This Means for Families & Counselors
For families and counselors, the past two years of global data point toward a quieter but more important truth: strategy matters more than ever. Not because admissions is becoming more competitive — though in some fields it is — but because the global student landscape is now shaped by forces that families can navigate only if they understand the new terrain.
Across every region, several principles consistently emerged from the data.

1. Outcomes — not prestige — must lead the conversation.
The 2023 SEVIS and Open Doors data make this unmistakably clear:
- Graduate enrollment grew 20% in one year.
- STEM and business analytics dominate the top majors.
- OPT participation is the strongest competitive driver across all regions.
Families are no longer chasing names. They are chasing:
- employability
- stability
- safety
- community
- and long-term visa pathways
This is the first moment in two decades where the U.S. is being chosen for outcomes, not simply for rank or history. That shift is good news for families — and grounding for counselors who advocate for fit over prestige.
2. Build the list around clarity: cost, safety, and structure.
In nearly every region of your series — APAC, Latin America, Africa, Europe — parents expressed the same three concerns:
- How safe is the environment?
- Where will my student live?
- Can we understand the real cost, without surprises?
Institutions that addressed these questions directly outperformed their peers. For families, the implication is simple:
Look for the schools that communicate the best — not the schools that market the most.
Signs of a strong fit include:
- transparent housing pages (with prices and photos)
- visa-prep webinars
- detailed CPT/OPT guidance
- published employment outcomes
- clear tuition and scholarship breakdowns
- parent-facing orientation materials
These are not luxuries. They are markers of institutional alignment.
3. Understand that different regions now behave very differently.
Families sometimes compare themselves to students from other parts of the world, assuming that international mobility is a uniform experience. That hasn’t been true for a long time, and it’s especially untrue now.
What the data shows:
- Indian students face tremendous competition in graduate STEM fields.
- Chinese undergraduates have become more cautious and selective.
- Latin American students value affordability and bilingual environments.
- Korean, Japanese, and Taiwanese families prioritize safety and reputation.
- African applicants face unique visa pressures — often requiring double documentation.
Each of these realities shapes the admissions landscape differently.
The best application strategies acknowledge those differences.
4. Use Early Decision and Early Action strategically — not emotionally.
Because the global landscape is shifting, ED/EA strategy is becoming more important, especially for:
- highly competitive majors (CS, engineering, business)
- institutions with limited international housing capacity
- families seeking merit aid
- students applying from high-volume countries (India, Nigeria, Vietnam, Korea, China)
ED is no longer simply a “first choice” signal — it is a timing strategy that can secure better odds in STEM programs, access to on-campus housing, and earlier visa appointments.
For families: Treat ED/EA like a logistics tool, not a romantic one.
5. For undergraduates: diversify beyond the traditional destinations.
Undergraduate seats are becoming harder to secure in:
- California
- Massachusetts
- New York
- Washington
- Texas
Meanwhile, high-quality undergraduate opportunities with strong outcomes can be found in:
- the Midwest (Minnesota, Wisconsin, Iowa, Illinois)
- the Mountain West (Utah, Colorado)
- the Southeast (Georgia, North Carolina, Florida)
- the mid-Atlantic (Maryland, Pennsylvania, Virginia)
These regions gained steadily as California and New York reached capacity — and many offer better housing, lower costs, and stronger student support.
6. For graduate students: anchor your list in research ecosystems, not rankings.
Graduate mobility is now the backbone of U.S. international education. But graduate admissions is not about the “top 50.” It’s about:
- faculty research
- lab capacity
- funded assistantships
- industry partnerships
- location-based OPT opportunities
- alumni networks in specific sectors
Students who build master’s/PhD lists around ecosystems — not league tables — enjoy stronger outcomes and better financial support.
7. For cost-conscious families: the 2+2 pathway is stronger than ever.
The combination of rising interest in community colleges, growth from Vietnam, Indonesia, and Latin America, and improving transfer articulation agreements means that the U.S. 2+2 model is becoming one of the most reliable affordability strategies for global families.
It allows students to access:
- lower initial tuition
- supportive English-learning environments
- academic momentum before transferring into a strong university
- full access to OPT at the end of the bachelor’s degree
This pathway is especially effective for families from APAC and Latin America who prioritize value and proximity.
8. Ask clear questions about support — because that determines persistence.
Based on thousands of student interactions in your role at InGenius Prep, the biggest indicators of whether a student thrives in the U.S. are:
- Mentorship access
- Housing stability
- Campus employment support
- Cultural communities
- Safety navigation
- Advisor responsiveness
Students succeed not because they picked the “right” university, but because they chose a system that supports them.
For counselors, this is a powerful shift:
The best advice is no longer “Find your dream school.” It’s “Find your stable environment.”
9. Apply early for visas — because demand is rising across all regions.
SEVIS’s 2023 numbers tell a clear story:
Visa demand grew alongside enrollment, especially in India, Ghana, Nigeria, Brazil, and Vietnam.
This means:
- Earlier appointments
- More documentation
- Higher scrutiny for certain fields
- Longer turnaround timelines
Families should treat visa preparation as part of the admissions process — not an afterthought.
10. Remember that international education is no longer about prestige — it’s about navigation.
The U.S. remains the strongest global destination not because of rankings, but because of:
- OPT
- research ecosystems
- sheer breadth of programs
- global employer recognition
- community networks
- and the upside of the U.S. job market
But students only benefit from those strengths if they can navigate:
- safety
- housing
- visas
- cost
- academic fit
- and campus support
This synthesis — and the entire Global Matriculation Analysis series — aims to make that navigation clearer, more honest, and grounded in data rather than assumptions.
VII. What This Means for Universities
For universities, the lessons of the 2022–2024 cycle are not subtle. Domestic enrollment is shrinking. The global landscape is fragmenting. Visa politics, housing shortages, and perceptions of safety now shape enrollment decisions as much as rankings or marketing budgets. And families everywhere — from India to Brazil to Vietnam to Nigeria — are making choices based on value and outcomes, not prestige alone.
In this environment, universities that thrive will be those that make a decisive shift from passive recruitment to strategic global alignment.
Below are the clearest implications for institutional leaders.

1. Build country-specific recruitment playbooks — not a single global strategy.
The era of “one-size-fits-all” international recruitment is over.
The data shows dramatic variation:
- India → graduate STEM + OPT orientation
- China → stabilized but selective undergraduate market
- Nigeria & Ghana → strong demand, high visa scrutiny
- Vietnam & Indonesia → robust community-college and transfer pipelines
- Brazil & Colombia → cost-conscious families, female-majority cohorts
- Middle East → persistent contraction and policy risk
- Europe → small, stable, academically elite, ROI-focused
If universities continue marketing to “international students” as a single segment, they will struggle. Families expect institutions to understand their context, their goals, and their constraints. The winners will be the universities that create tailored strategies for each region — not generic messaging.
2. Invest in visa support — it’s the single highest-yield intervention.
Across the entire dataset, visa concerns emerged as one of the top barriers to enrollment:
- Up to 41% denial rates in certain regions
- High scrutiny for West Africa, South Asia, and parts of Latin America
- Families fearful of paperwork errors, insufficient financial evidence, and inconsistent embassy procedures
Universities cannot control visa decisions, but they can control confidence.
High-yield strategies include:
- Pre-departure visa webinars with alumni
- One-on-one document checks
- Embassy-provided guidance tools
- Parent-facing instructions
- Mock interviews
- Country-specific FAQs
These interventions consistently improve yield — because trust increases conversion.
3. Safety and housing transparency are now differentiators, not details.
In the APAC, Latin America, and Europe chapters, families repeatedly emphasized:
- safety on and near campus
- off-campus housing shortages
- transportation
- clarity of emergency response
- mental health support
This matters enormously for families sending daughters abroad. It matters for parents who have never visited the U.S. And it matters for students who depend on reliable housing to succeed academically.
High-performing institutions now publish:
- real-time housing availability
- off-campus housing maps
- clear transportation guides
- parent-oriented safety briefings
- multilingual versions of emergency protocols
These materials drive yield as much as academic information.
4. Career outcomes must be published — and proven.
OPT and STEM OPT are the U.S.’s greatest competitive advantages, but families cannot make decisions on hope. They require clarity.
Universities should publish:
- job placement rates (actual, not anecdotal)
- salary medians
- CPT/OPT hiring patterns
- employer pipelines by major
- graduate school placement
- alumni testimonials from students of similar background
Your China and India chapters made this clear: outcomes are now the currency of trust.
If institutions cannot show the career return on investment, they lose students to competitors who can — including in Canada, Australia, and the UK.
5. Diversify markets intentionally — not reactively.
The institutions hardest hit in the past five years were those heavily dependent on one market (especially China). Diversification cannot be a last-minute response; it must be a design principle.
Based on the full synthesis, priority markets differ by goal:
If the goal is STEM graduate growth:
India, Nigeria, Vietnam, Taiwan
If the goal is undergraduate stabilization:
Vietnam, Brazil, Mexico, Korea, Indonesia
If the goal is long-term pipeline building:
Ghana, Kenya, Philippines, Colombia, Bangladesh
If the goal is balanced gender enrollment:
Brazil, Vietnam, Japan, Colombia
If the goal is affordability and transfer pathways:
Vietnam, Indonesia, Mexico, Peru
Universities should be building multi-year market portfolios, not single-year recruitment trips.
6. Expand academic offerings in applied and interdisciplinary fields.
Demand is growing fastest in:
- computer science
- data science
- engineering
- business analytics
- cybersecurity
- health sciences
- interdisciplinary tech/business programs
These fields align with:
- global labor shortages
- OPT demand
- AI and digital transformation
- employer pipelines
Institutions without strong applied programs risk becoming invisible in global markets — especially as families prioritize employability.
7. Build culturally responsive student support ecosystems.
The data shows that students thrive in environments that offer:
- advising that is sensitive to the cultural and linguistic context
- peer mentorship from same-region communities
- parent-inclusive communication
- mental health support tailored to international needs
- early-arrival orientation programs
- graduate-level social integration initiatives
Universities that invest in these systems not only improve retention — they build reputational momentum in communities across Asia, Africa, and Latin America.
8. Strengthen institutional honesty: show your real strengths, not imagined ones.
The new global landscape rewards honesty and punishes over-claiming. Students and families — especially from India, Vietnam, China, and Brazil — are becoming more sophisticated:
- They fact-check outcome claims
- They cross-compare curricula
- They consult alumni groups
- They ask for examples, not slogans
Institutions that communicate authentically — acknowledging trade-offs while emphasizing true strengths — generate trust and attract stronger applicants.
9. Understand that international recruitment is now a campus-wide project.
It is no longer enough for admissions teams alone to carry global strategy. The institutions that grow consistently do the following:
- International admissions align with academic departments
- Faculty participate in recruitment and yield events
- Career Services integrates OPT/CPT advising into the curriculum
- Student affairs leads early-arrival programming
- Housing collaborates on parent-facing materials
- Communications teams build multilingual content
- Institutional research tracks global ROI
International enrollment is no longer a separate branch.
It is one of the most important engines of financial stability and academic vitality.
10. Institutions that grow in the next decade will be those that build trust — not those that build slogans.
Across the entire series, one theme kept recurring: families and students respond to trust.
Trust in:
- visa support
- safety
- housing
- community
- clarity
- outcomes
- long-term opportunity
Universities that embrace this shift — openly, consistently, and strategically — will define the next 10 years of global enrollment. Those that do not will struggle, regardless of ranking or history.
VIII. Conclusion: The Global Enrollment Map Has Been Redrawn
What the past three years have shown — across Open Doors, SEVIS, institutional datasets, and the lived experiences of families — is that we are not returning to a pre-2019 world. The forces shaping global mobility today are different in scale, different in motivation, and different in structure. The numbers may look familiar, but the patterns underneath them are entirely new.
Across the full Global Matriculation Analysis series, one theme rises above everything else:
We are entering a multi-polar era of international education — one defined not by a single dominant market, but by the interplay of India’s ascent, China’s stabilization, Africa’s demographic surge, Southeast Asia’s resilience, Latin America’s predictability, Europe’s selectivity, and the Middle East’s long-term contraction.
In this new world:
- The U.S. remains the global leader, but its strength comes from ecosystems, not just prestige.
- Families are choosing institutions for outcomes, safety, and transparency, not rankings alone.
- Graduate education now drives the system; undergraduate recruitment must adapt accordingly.
- Community colleges, public research universities, and urban privates have become the structural pillars of U.S. global enrollment.
- Visa confidence, housing security, and clear OPT pathways matter more than brochures or slogans.
- Global recruitment is now shaped as much by policy shifts in Canada, the UK, and Australia as by U.S. strategy.
- Gender, geography, and employability shape who comes, where they go, and what they need to thrive.
The 2022–2024 period marks the beginning of this new phase — not the end of one.
For families, this means there has never been a better moment to approach U.S. admissions with clarity rather than anxiety. The market has widened, diversified, and matured. The best opportunities increasingly lie in institutions that communicate honestly, support generously, and match a student’s goals with the right ecosystem.
For universities, this moment demands strategy. The institutions that will grow over the next decade are those who anchor their work in:
- transparent outcomes
- culturally responsive student support
- real global diversification
- investments in safety and housing communication
- graduate-level research and employer pipelines
- and a deep understanding of the regions they serve
Those who expect growth to happen automatically — because it once did — will struggle.
The global enrollment map has been redrawn. New regions are rising. Old patterns are shifting. And the next chapter of international education will belong to the institutions and families who navigate these changes with both intelligence and intention.
This synthesis is the beginning of that map. In the months and years ahead, as new policies emerge and demographic pressures intensify, we’ll continue updating the Global Matriculation Analysis series with the same commitment to clean data, honest interpretation, and student-centered insight.
Because strategy beats noise. Because outcomes matter more than slogans. And because students — wherever they come from — deserve a clear, accurate picture of the world they are moving through.