By Lindsey Kundel, Editor in Chief, InGenius Prep
Key Points
- Reduced Transparency is a Structural Problem: Highly selective schools like Harvard, Princeton, and Stanford declined to release their Early Action statistics, making it significantly harder for families without expert guidance to gauge competitiveness and calibrate their application strategy.
- The Deferral is Not a “Soft Yes”: For the majority of applicants at highly selective institutions (where deferral rates can reach 70–80%), a deferral is a structured delay before a likely negative Regular Decision outcome. Converting a deferral requires deliberate, strategic action, not quiet waiting.
Binding ED is Coming to Public Flagships: The University of Michigan’s move to introduce binding Early Decision for the first time signals a major shift. Expect more elite public universities to adopt this mechanism to manage yield pressures in the coming cycles.
We’re writing this the week after Ivy Day — which means, for the first time all cycle, the full picture is visible.
Most early admissions content gets published in December, mid-stream, when only ED1 and REA results are in and half the class hasn’t been decided yet. What you get then is reaction, not analysis. We wanted to wait. Because what the complete 2025–2026 early admissions cycle reveals — taken together across every round — is a story with four distinct threads that every family planning for next year needs to understand.
Thread One: Some Schools Stopped Telling You What’s Actually Happening
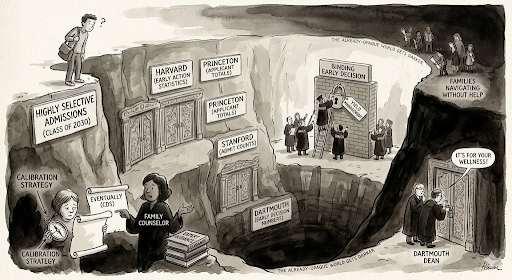
The most structurally significant development of this cycle received almost no mainstream attention.
Harvard, Princeton, and Stanford — three of the most applied-to universities in the country — declined to release their Early Action admissions statistics for the Class of 2030. No application totals. No admit counts. No early acceptance rates. They will share overall figures eventually through the Common Data Set, but the mid-cycle data that families and counselors have relied on for years to gauge competitiveness simply wasn’t published. Dartmouth also withheld its Early Decision numbers, with its Dean of Admissions citing student wellness as the rationale — the idea being that releasing mid-cycle statistics might discourage talented students from applying in the Regular Decision round.
We want to be direct about what this means: when schools stop releasing early data, families lose one of the most important signals available for calibrating whether a strategy is working. The wellness framing isn’t without merit — the anxiety around admissions data is real and documented — but the practical effect is that families making high-stakes decisions about where to apply, whether to commit to ED, and how to interpret a deferral are doing so with meaningfully less information than they had five years ago. That information asymmetry doesn’t hurt schools. It hurts students — particularly those who don’t have access to expert guidance that can read the landscape without the published numbers.
This is a trend worth watching closely. If more schools follow, the already-opaque world of highly selective admissions gets darker for every family navigating it without help.
Thread Two: The Numbers That Were Released — What They Actually Show
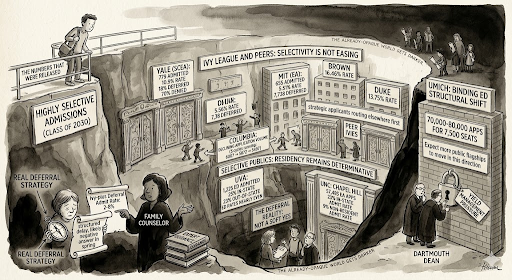
For the schools that did report early data, the picture is consistent across every tier: selectivity is not easing, ED advantages are real but school-specific, and the deferral has become the dominant early-round outcome at the most competitive institutions.
At the Ivy League and peers: Yale admitted 779 students through Single Choice Early Action from 7,140 applications — a 10.9% early rate — then deferred 18% of applicants to Regular Decision and denied 70%. At Yale, the most likely outcome of applying early is a rejection in December, not a deferral. Brown admitted 890 students from 5,406 Early Decision applications — 16.46%, down from 17.92% the prior year. Duke admitted 847 from 6,159 ED applications — 13.75% — and notably, Duke’s ED application volume declined from 6,627 the year before, making the compression of rates even more telling. MIT received 11,883 Early Action applications and admitted 655 students, a 5.51% rate, continuing a multi-year tightening trend. MIT also deferred 7,738 applicants in December — meaning the overwhelming majority of MIT early applicants spent the holiday season in limbo, not celebration.
Columbia is worth separate attention. Its early application volume has declined for three cycles running — from 6,007 for the Class of 2028, to 5,872 for the Class of 2029, to 5,497 this cycle. Application decline at a school with Columbia’s profile typically signals either students self-selecting out due to perceived difficulty, or strategic applicants routing elsewhere first. Either reading has implications for how competitive Columbia ED actually is relative to its peer Ivies.
At selective publics: UVA admitted 1,225 Early Decision applicants from 5,108 applications, with in-state and out-of-state ED rates landing close together at 25% and 23% respectively. UNC Chapel Hill received 57,495 early action applications and admitted 7,151 students — with the in-state rate at 23% versus just 9% for non-residents, a sharp reminder that residency remains one of the most determinative factors in public flagship admissions regardless of the round.
The deferral reality: At highly selective colleges, 30–80% of early applicants are deferred rather than admitted or rejected outright. At schools like Harvard and MIT, that figure approaches 70–80%. Of those deferred students, only 2–8% are eventually admitted at Ivy-plus institutions. The deferral is not a soft yes. For most students at most schools, it is a structured delay before an answer that will likely come back negative in the spring. That’s not a reason for despair — but it is a reason to have a real deferral strategy, not just a politely worded Letter of Continued Interest.
The public flagship structural shift: The biggest institutional news of this cycle was the University of Michigan introducing binding Early Decision for the first time in its history. UMich received between 70,000 and 80,000 applications for approximately 7,500 seats, and analysts estimated the school plans to admit roughly half the class from the combined ED/EA pools. A flagship public university adopting binding ED — a mechanism that until recently was almost exclusively a private college strategy — signals something important: as application volumes at elite publics go national and international, yield management pressures are following right behind them. Expect more public flagships to move in this direction over the next several cycles.
Regular Decision Results: The Full Picture — Updated Post-Ivy Day
Ivy Day 2026 arrived on Thursday, March 26, and the complete picture confirms what the early round data suggested: this was the most selective cycle on record at the schools that bothered to publish numbers — and the schools that didn’t publish numbers made a story of their own.
The rates that were released
Among the Ivies that disclosed official data, the compression is stark. Columbia admitted just 4.23% of applicants for the Class of 2030, down from 4.94% the prior year, from the largest applicant pool in the university’s history — over 57,000 applications. Yale admitted 2,328 students from 54,919 applications, a 4.24% overall rate, which the university described as the second-lowest in its history. Brown admitted 2,564 students from 47,937 applications — a 5.35% rate — following a 12% rise in applications the prior cycle. Dartmouth offered admission to 1,687 students from 28,863 applications, a 5.8% rate and the sixth consecutive year with an overall admit rate below 6%.
The rates that weren’t
Harvard, Princeton, Penn, and Cornell declined to release official admissions statistics for the Class of 2030 — in Harvard’s case, for the second consecutive year. Based on reporting from admissions data trackers, Harvard’s estimated acceptance rate is approximately 3.7%, down from 4.18% for the Class of 2029; Princeton’s is estimated near 3.9%, down from 4.42%; Penn’s near 4.1%, down from 4.92%; and Cornell’s near 6.9%, down from 8.38%. These are estimates, not official figures — which is precisely the point raised in Thread One of this piece. When half the Ivy League withholds its numbers, the families relying on published data to calibrate strategy are working with an incomplete picture.
The ED advantage, in concrete terms
Where early data was available, the ED advantage was real and measurable — but uneven across schools. At Penn and Columbia, ED acceptance rates ran roughly two to three times higher than the Regular Decision rate. At schools like Yale and Brown, the early premium existed but was narrower. The practical implication: applying ED to the right school, for the right reasons, remains one of the few structural levers available to applicants. Applying early indiscriminately — to a school that isn’t a genuine first choice, or where the ED premium is marginal — doesn’t move the needle in the same way.
Application volume trends
The volume story this cycle cuts in two directions. Several schools set application records: Columbia drew its largest pool ever, and Penn received over 61,000 applications — though notably, that Penn figure represented a significant decline from the prior cycle’s pool of over 72,000. Yale received approximately 52,250 applications, continuing to climb despite reinstating its standardized testing requirement. The broader pattern: application volumes across highly selective schools keep rising even as testing requirements return, suggesting that the cultural habit of applying to more schools — formed during the test-optional era — has not reversed.
One notable outlier: the testing landscape
This cycle exposed how unevenly the Ivy League has diverged in its post-pandemic approach to standardized testing. Penn and Brown required SAT or ACT scores. Dartmouth had already reinstated testing. Yale moved to a test-flexible model, allowing SAT, ACT, AP, or IB scores. Princeton remained test-optional through fall 2026, as did Columbia. For applicants, this means there is no single testing strategy that applies uniformly across the Ivy League — school-by-school analysis matters more than it did five years ago, when most schools were operating under the same test-optional framework.
What this means looking ahead
The full-cycle picture reinforces the five takeaways outlined at the close of this piece. The ED advantage is real but school-specific. The transparency retreat is accelerating. Application volumes are not receding. And the students who navigated this cycle best were those who understood the landscape clearly enough to work within it — rather than assuming the rules were the same as they were even two or three cycles ago.
Thread Three: The Landscape Is Genuinely Global Now

One of the most meaningful shifts of the past several cycles isn’t captured in any Ivy League acceptance rate: a growing number of highly competitive students are deliberately building application strategies that span continents — and this cycle, that approach paid off significantly.
At InGenius Prep, our students earned early admissions offers across 24 UK, EU, and Asia Pacific institutions this cycle, with particular strength at the University of Edinburgh (8 acceptances), UCL, King’s College London, University of St Andrews, and University of Manchester (6 acceptances each). For students who know how to build a global school list, schools like Edinburgh, UCL, and St Andrews aren’t consolation options — they’re genuinely world-class universities with earlier and more predictable acceptance timelines than the US process, which matters enormously when you’re managing application fatigue across a long list.
This connects to a broader trend we’re tracking. As we detailed in our recent piece on the higher education demographic cliff, international student enrollment at US universities declined 17% in fall 2025, as visa uncertainty and shifting global perceptions of American higher education prompted students and families to look beyond US borders. That same uncertainty is now prompting US-based applicants to build more internationally diversified lists than they might have five years ago. The students who are already thinking this way are ahead of the curve.
Thread Four: What InGenius Prep Saw in This Cycle
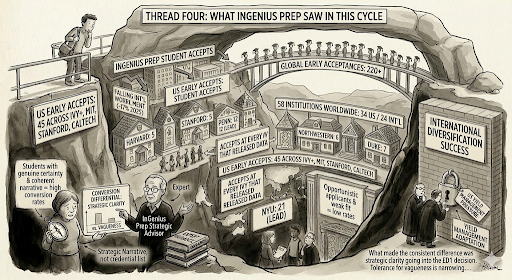
Across our student body, InGenius Prep recorded early admissions acceptances at 58 institutions worldwide this cycle — 34 in the US and 24 internationally — for a combined total of more than 220 early acceptances before Regular Decision results were even released.
In the US, our students earned 45 early acceptances across the Ivy League, MIT, Stanford, and Caltech combined, including 5 each at Harvard and Stanford, 12 at Penn, 6 at Northwestern, and 7 at Duke. Across all 30 top-50 national universities where our students were admitted early, Penn led with 12 acceptances and NYU with 21 — the latter a reflection of how many genuinely strong students now treat NYU as a serious target. Our students were admitted early to every Ivy League institution that released early data this cycle.
When Regular Decision results came in, those early gains compounded significantly. Across the full cycle, our students earned 13 acceptances at Harvard, 24 at Stanford, 22 at Penn, 20 at Columbia, 17 at Cornell, and 5 at MIT and Princeton respectively — with a combined 540 acceptances across the top 30 national universities. NYU climbed to 44 total acceptances and UC San Diego led all institutions with 50, reflecting how deliberately our students built lists that extended beyond the traditional Ivy-or-bust framework. In total, our students were admitted to every Ivy League school and to all but two of the top 50 national universities on the list.
What made the consistent difference this year was strategic clarity going into the ED1 decision. Students who applied ED with genuine certainty about their first choice — and who had built their application around a coherent, specific narrative rather than a list of credentials — converted at significantly higher rates than students who applied early opportunistically or without a clear sense of fit. That’s not a surprising finding, but it becomes more consequential every cycle as the early pools grow more competitive and the tolerance for vagueness in application strategy narrows.
What This Means for Next Year’s Applicants
Five things we’d want every family beginning the 2026–2027 cycle to internalize from what this year revealed:
The ED advantage is real — but it’s school-specific and not uniform. At some schools, applying ED meaningfully increases your odds relative to Regular Decision. At others, the gap is narrower than families assume. Understanding where the genuine advantage lives requires school-by-school analysis, not a general policy of “always apply ED to your first choice.”
The deferral is a decision point, not a waiting room. Students who converted deferrals to admissions in the spring almost always took deliberate, strategic action in the intervening months — substantive updates, strong mid-year grades, a well-crafted Letter of Continued Interest that added genuine new information rather than restating the original application. Quiet waiting almost never works at the schools where conversion rates are already 2–8%.
The transparency retreat is a structural problem for unguided families. When Harvard, Princeton, Penn, Cornell, and Stanford withhold admissions data — some for the second consecutive year — the families who suffer most are those relying on published statistics to calibrate strategy.
UMich’s ED move is a preview, not an anomaly. Binding Early Decision is coming to more selective public universities over the next several cycles. Families who understand this shift early will build their timelines accordingly; those who assume public flagships operate the way they did five years ago will be caught off guard.
A global list is increasingly a smart list, not a backup plan. Students who approach this process with genuine openness to UK, EU, and Asia Pacific options — and who build those applications with the same intentionality they bring to US applications — are creating more pathways to exceptional outcomes. For many students, that’s not a consolation strategy. It’s the right one from the start.
The 2025–2026 cycle confirmed what we see every year in sharper relief: the students who navigate this process best are the ones who understand it clearly enough to work within it strategically — and who have the support to execute when the stakes are highest.
If your family is beginning that process for next cycle, we’d welcome the conversation.
Ready to get started? Schedule a free strategy call to map out your next steps.
Sources: InGenius Prep 2025 Early Admissions Results | InGenius Prep 2025 UK & Asia Pacific Early Admissions Results | Top Tier Admissions Class of 2030 Early Results | College Kickstart Class of 2030 Early Decision and Early Action Results | Deloitte 2026 Higher Education Trends
Frequently Asked Questions (FAQ)
Q: Why did schools like Harvard, Princeton, and Stanford stop releasing their Early Action statistics?
A: These highly selective institutions, along with Dartmouth (for ED numbers), declined to release their mid-cycle admissions statistics (application totals, admit counts, acceptance rates). While Dartmouth cited student wellness as a rationale, the practical effect is a structural problem of reduced transparency, making it significantly harder for unguided families to gauge competitiveness and calibrate strategy.
Q: Is a deferral in the early round a “soft yes” or a positive sign for my application?
A: The article argues that for the majority of applicants at highly selective institutions, a deferral is not a “soft yes.” At schools where deferral rates can approach 70–80%, a deferral is a structured delay before a likely negative Regular Decision outcome. Conversion rates from deferral to acceptance at Ivy-plus schools are typically low (2–8%), meaning deliberate, strategic action is required to have a chance, not quiet waiting.
Q: What is the significance of the University of Michigan introducing binding Early Decision?
A: UMich’s move to binding Early Decision is the biggest institutional shift of this cycle, signaling a trend for elite public universities. As application volumes for these schools go national and international, they are adopting binding ED—historically a private college strategy—to manage yield pressures. The article suggests more public flagships will follow this direction in the coming cycles.
Q: How did the decline in early application volume at Columbia impact its selectivity?
A: Columbia’s early application volume has declined for three consecutive cycles. This application decline at a school of Columbia’s profile can signal either that students are self-selecting out due to perceived difficulty, or that strategic applicants are routing their first choice elsewhere. Either reading has implications for how competitive Columbia ED is relative to its peer Ivies.
Q: Should applicants consider applying to international universities like those in the UK, EU, or Asia Pacific?
A: Yes. The article highlights that building a genuinely global application list is increasingly a “smart list,” not a backup plan. International institutions offer genuinely world-class options with earlier and more predictable acceptance timelines than the U.S. process, creating more pathways to exceptional outcomes for competitive students.
Q: What was the single most important factor for InGenius Prep students who were admitted early this cycle?
A: Strategic clarity going into the ED1 decision was the most consistent difference. Students who applied with genuine certainty about their first choice and who had built their application around a coherent, specific narrative (rather than just credentials) converted at significantly higher rates.