By Lindsey Kundel, Editor in Chief, InGenius Prep
Every year, families ask some version of the same prestige question:
“If my child attends a top-ranked university, will that improve their chances of getting into medical school?”
In practice, I’ve seen families assume that brand alone carries students into medicine. The data suggests something more structural.
Unlike law school (which we also covered recently) — where argumentation, writing culture, and LSAT performance dominate — medical school admissions operate within a different structural framework. The Association of American Medical Colleges (AAMC) publishes annual admissions data that make this clear: GPA in rigorous science coursework and MCAT performance are foundational, with median MCAT scores at the most selective research programs frequently clustering at or above 520.. Research exposure, clinical experience, and sustained engagement in scientific environments are expected. Letters of recommendation often come from principal investigators and lab supervisors, not seminar instructors.
AAMC data consistently shows that applicants with GPAs above 3.79 and MCAT scores above 517 experience dramatically higher acceptance rates than those in lower metric bands — underscoring how tightly admissions decisions cluster around academic performance.
Medical admissions reward preparation in scientific ecosystems — and some ecosystems simply make that preparation easier to build than others.
And yet, when we examine alumni datasets across nearly two decades, feeder density patterns emerge that are far from random.
Certain undergraduate institutions consistently send a disproportionately high percentage of graduates to medical school. When we isolate Tier 1 research institutions — including those recognized by Times Higher Education and major research metrics — that density narrows further.
Prestige matters. Infrastructure matters more.
Defining “Top” Medical Schools
Unlike law schools, several elite medical schools have pulled back from participating in certain ranking systems, complicating traditional ranking-based analysis.
To avoid relying solely on U.S. News (which many research institutions have exited), this analysis integrates:
- College Transitions feeder datasets
- AAMC admissions framing
- Times Higher Education U.S. Medicine Rankings
- Research Tier 1 institutional clustering
The undergraduate institutions below represent the highest MD-producing institutions feeding Tier 1 medical schools.
Medical school pipelines are not random. They are ecosystem-reinforcing systems.
Medical Regional Gravity: The Structural Reality
When we examine undergraduate institutions alongside their most common medical school destinations, regionalism becomes unmistakable.
Medicine is more geographically anchored than law. Why?
Because medicine is built around:
- Hospital systems
- NIH funding clusters
- Faculty research collaborations
- Clinical rotation geography
- Lab infrastructure continuity
NIH funding concentration is particularly important to note because it often determines where major biomedical laboratories, faculty grant portfolios, and research trials are housed — shaping the volume of undergraduate exposure to real clinical science.
And it helps to illustrate clearly that students embedded in biomedical ecosystems frequently (and understandably) choose to remain within them.
The Northeast Research Corridor
Consider the density and destinations of the following institutions:
- Harvard (24.06%) → Harvard Medical School, Yale
- Yale (14.91%) → Harvard, Yale
- Columbia (11.29%) → Columbia VP&S, Harvard
- Princeton (10.37%) → Penn, Harvard
- Dartmouth (9.00%) → Harvard, Cornell
- Penn (6.52%) → Penn, Harvard
- Brown (5.74%) → Penn, Yale
Boston, New Haven, New York, and Philadelphia form one of the most concentrated biomedical research corridors in the world.
These percentages reflect cumulative alumni data over time, not annual graduating class outcomes.
This is not prestige recycling prestige; it is corridor entanglement.
Students trained within this axis often matriculate into medical schools within it. Shared hospital systems and faculty mobility reinforce continuity.
The West Coast Ecosystem
California displays even clearer regional retention:
- UC Berkeley → UCLA, UCSF
- UCLA → UCLA, UCSF
- UC San Diego → UCLA, UCSD
- Stanford → Stanford, Harvard
Even though Berkeley (2.33%) and UCLA (2.00%) show lower proportional density than elite privates, their medical school destinations are overwhelmingly within California.
The UC medical system functions as a tightly integrated research environment.
Stanford adds an interesting layer: strong regional retention plus elite spillover to Harvard.
Regional gravity + national pull.
The Midwest Continuity Pattern
The Chicago–St. Louis–Ann Arbor–Cleveland axis shows similarly strong retention:
- Northwestern (9.43%) → Feinberg, WashU
- University of Chicago (3.21%) → Pritzker, Northwestern
- Notre Dame (2.91%) → Northwestern, Michigan
- Michigan (2.64%) → Michigan, Case Western
- Case Western (4.66%) → Case Western, WashU
Students trained in Midwest biomedical environments frequently remain within them for medical school.
The Southern & Texas Research Spine
The Southeast and Texas form another identifiable cluster:
- Duke (10.36%) → UNC, Harvard
- Rice (7.14%) → Baylor, Harvard
- UNC (2.53%) → UNC, Vanderbilt
- Vanderbilt (3.99%) → Vanderbilt, Emory
- Emory (4.68%) → Emory, UNC
- UT Austin (0.72%) → Baylor, Harvard
Strong regional pipelines exist, with selective spillover to Harvard.
Proportion vs. Scale: A Critical Distinction
Elite privates show dramatically higher proportional medical density:
| Institution | % to MD |
| Harvard | 24.06% |
| Stanford | 16.48% |
| Yale | 14.91% |
| Columbia | 11.29% |
| Hopkins | 10.70% |
| Princeton | 10.37% |
| Duke | 10.36% |
Large publics send high absolute numbers but lower proportions:
| Institution | % to MD |
| Michigan | 2.64% |
| Berkeley | 2.33% |
| UCLA | 2.00% |
| Washington | 0.98% |
| UT Austin | 0.72% |
This suggests:
- Elite privates have concentrated pre-med cultures.
- Larger publics offer scale but broader career distribution.
- Self-selection and advising intensity matter.
The College Transitions’ From Pre-Med to MD analysis adds another crucial layer: it does not just count medical graduates — it contextualizes them relative to the size of the undergraduate cohort. In that framing, Johns Hopkins University stands out, with roughly 4% of its alumni progressing into medical school — the highest proportion nationally. Harvard University (~3.7%) and Yale University (~3.4%) follow closely. Rice University, often overlooked in national rankings, posts a strong ~3.1% rate as well.
These proportional figures reinforce the structural insight above. Absolute MD counts tell part of the story, but the proportionate lens reveals how concentrated a medical pipeline an undergraduate ecosystem produces relative to its size. Elite privates tend to dominate proportional feeders, while large publics make meaningful contributions in absolute terms.
The Liberal Arts Overperformance Effect
While medicine favors research infrastructure more than law does, small liberal arts colleges still punch above their weight in medical school placement.
Institutions such as Amherst (~2.6%) and Haverford (~2.5%) send meaningful proportions of graduates into medical school despite lacking large affiliated hospital systems. Their advantage operates differently.
At many liberal arts colleges, pre-med advising begins earlier and remains highly individualized. Faculty-student ratios are lower. Laboratory placement often occurs through intentional partnerships rather than competition within massive internal research ecosystems. Students may have fewer total research labs on campus — but they often have more direct faculty access within the labs that do exist.
The trade-off is obvious. A liberal arts college may not offer 40 on-campus biomedical labs. But it may offer direct access to the two or three that matter — without internal competition from hundreds of pre-med peers.
Infrastructure dominates at scale, but mentorship can meaningfully compensate — especially when students are intentional about securing research placements early.
The pathway differs. The outcome can still converge.
Top Tier vs. All Medical Schools
There is a meaningful difference between:
- Feeding Tier 1 research medical schools, and
- Feeding medical schools overall
When isolating elite research institutions (Harvard, Hopkins, Stanford, Penn, UCSF), feeder density narrows sharply toward the most selective undergraduate institutions.
In this analysis, “Tier 1” refers to medical schools with sustained NIH funding dominance, major academic medical center affiliations, and high research output — institutions that consistently appear at the top of Times Higher Education research rankings and major biomedical funding tables. These are schools where laboratory infrastructure, clinical research volume, and faculty grant portfolios operate at national scale.
When expanding to all medical schools nationwide, representation broadens significantly — especially among selective public universities.
Ambition level changes the statistical landscape.
Top 14 Medical School Feeder Core Comparison
When viewed collectively, the Top 14 undergraduate feeders reveal three overlapping characteristics: extreme selectivity, embedded research hospitals, and strong regional continuity. What differs is not whether they send students to medical school — but where those students tend to land.
Below is a structured summary of the highest MD-producing undergraduate institutions feeding Tier 1 medical schools.
| Rank | Undergraduate | MD Grads | Top Destinations | Feeder Profile |
| 1 | Harvard | 1,742 | Harvard, Yale | Elite Retention |
| 2 | Stanford | 1,269 | Stanford, Harvard | West Coast + National |
| 3 | Columbia | 998 | Columbia, Harvard | Northeast Corridor |
| 4 | Yale | 991 | Harvard, Yale | Elite Corridor |
| 5 | Michigan | 863 | Michigan, Case Western | Midwest Anchor |
| 6 | Northwestern | 811 | Feinberg, WashU | Midwest Continuity |
| 7 | UC Berkeley | 769 | UCLA, UCSF | UC System Retention |
| 8 | Penn | 698 | Penn, Harvard | Northeast Ivy Pathway |
| 9 | Duke | 694 | UNC, Harvard | Southern Anchor |
| 10 | UCLA | 669 | UCLA, UCSF | California Biomed |
| 11 | Cornell | 664 | Weill Cornell, Penn | NYC Corridor |
| 12 | NYU | 630 | NYU, Cornell | Urban Cluster |
| 13 | Johns Hopkins | 599 | Hopkins, Penn | Research Powerhouse |
| 14 | Princeton | 563 | Penn, Harvard | Selective Spillover |
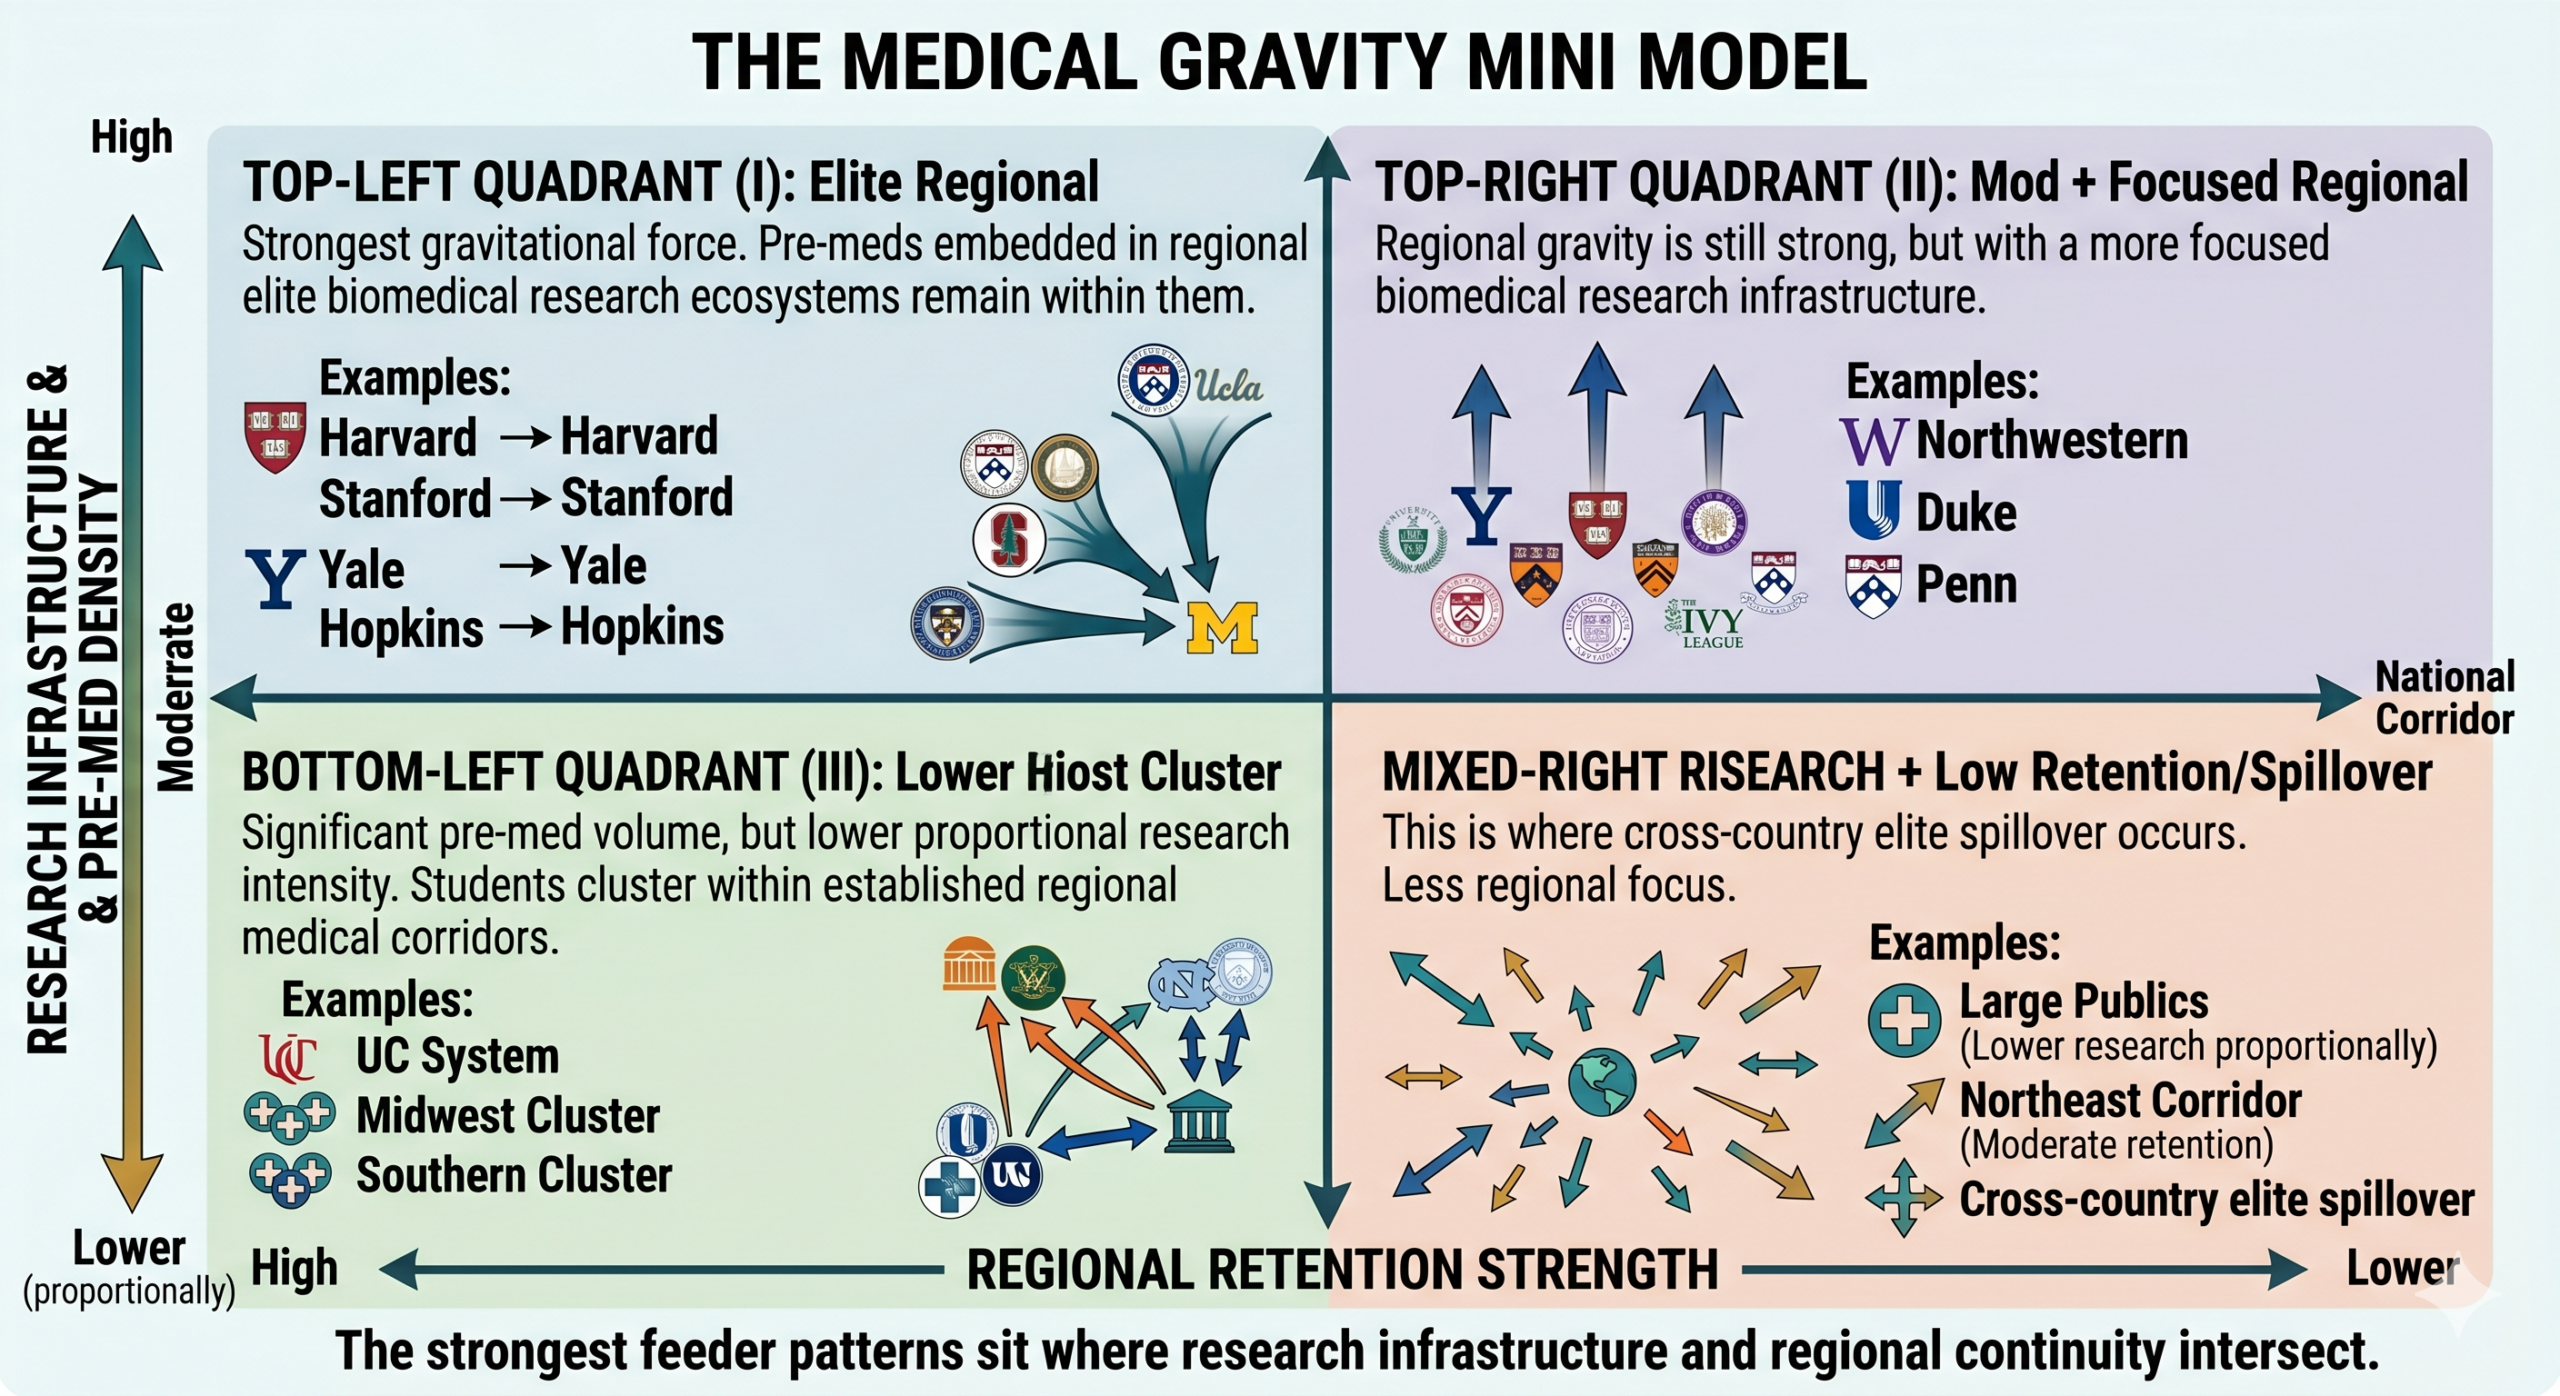
The Medical Gravity Mini Model
When we compress the data into a single framework, medical school placement resolves into two reinforcing forces: research infrastructure and regional retention.
Vertical Axis: Research Infrastructure & Pre-Med Density
- High: Harvard, Stanford, Yale, Hopkins
- Moderate: Northwestern, Duke, Penn
- Lower (proportionally): Large publics
Horizontal Axis: Regional Retention Strength
- High: UC system, Midwest cluster, Southern cluster
- Moderate: Northeast corridor
- Lower: Cross-country elite spillover
The strongest feeder patterns sit where research infrastructure and regional continuity intersect.
Medicine behaves like a gravitational system. Students rarely drift randomly across the country; they tend to move along established biomedical corridors.
Strategic Implications for Families
If a student’s goal is to attend a Tier 1 research medical school, undergraduate strategy should consider:
- Research intensity and NIH funding density
- Access to affiliated hospitals
- Pre-med advising culture
- Regional ecosystem alignment
- MCAT performance environment
Consistent with feeder proportions, selectivity bands matter. The From Pre-Med to MD analysis from College Transitions finds that the most selective private institutions send the largest share of their graduates into medical school, followed by extremely selective public research universities. Even when focusing on top-tier research programs, this pattern holds. That means attending an elite undergraduate institution does not guarantee entry into medicine, but it systematically correlates with the structural advantages (lab access, advising networks, MCAT culture) that medical schools reward.
The strongest preparation environments combine rigorous science training, embedded clinical access, and advising cultures that understand the MCAT landscape early.
Medical pathways are not simply about brand. They are about ecosystems.
Conclusion: Law vs. Medicine
In our law analysis, we saw vertically concentrated prestige corridors.
In medicine, we see something different.
Law tends to be nationally fluid and prestige dense. Medicine, by contrast, is more regionally anchored — and far more dependent on research infrastructure.
Law school rewards argumentative preparation. Medical school rewards scientific immersion.
In both cases, undergraduate institutions matter — but not generically.
The undergraduate decision does not determine medical school outcomes. But it does shape the ecosystem in which preparation unfolds — and preparation is what medical admissions ultimately reward.
Prestige can increase exposure. Research infrastructure tends to increase readiness. Regional gravity quietly increases the odds of staying within a given biomedical ecosystem.
Students are not admitted because of a logo. What ultimately gets rewarded is what they built within that environment. The institutions that appear most frequently in Tier 1 medical pipelines are simply those that make building that preparation more structurally probable.