
Why headline acceptance rates often mislead international applicants—and how to interpret the data more accurately
By Lindsey Kundel, Editor in Chief, InGenius Prep
Key Points
International acceptance rates at U.S. universities often differ significantly from the headline acceptance rates most families see—and misunderstanding that difference can lead to unrealistic expectations or poorly balanced college lists.
This analysis examines overall undergraduate acceptance rates, published international acceptance rates, and international enrollment patterns across the top 30 U.S. universities for the 2025–2026 admissions cycle. The data shows that at many elite institutions, international applicants face meaningfully more selective odds than domestic applicants, even when overall acceptance rates appear moderate.
- One acceptance rate cannot describe two admissions systems.
At many top universities, international applicants are evaluated within a more constrained admissions framework shaped by funding availability, enrollment caps, and need-aware policies. - International acceptance rates are often lower than overall acceptance rates—sometimes dramatically so.
The gap between these rates is widest at certain elite private universities and public flagships, where international demand is high but available seats are limited. - High international enrollment does not mean easier admission.
Universities such as NYU, MIT, and Stanford enroll large international student populations due to strong yield and global brand pull—not because international admission is less selective. - Public universities operate under structural constraints.
While some public flagships show higher acceptance rates, state residency priorities and non-resident enrollment caps limit international outcomes. - A small number of institutions show more balanced outcomes.
Carnegie Mellon University stands out as a rare case where international and overall acceptance rates are closely aligned, though results still vary by major and college.
The takeaway for international applicants is clear: acceptance rates are signals, not promises. Successful international college lists are built by understanding how institutions actually admit and enroll international students—not by chasing the lowest headline percentage.
Why Acceptance Rates Don’t Mean the Same Thing for International Students
For international students applying to U.S. universities, acceptance rates are often treated as a shortcut for understanding risk.
A school with a 9% admit rate feels possible.
A school with a 4% admit rate feels out of reach.
I get why families latch onto these numbers. They’re concrete. They’re published. They look objective.
But for international applicants, those numbers often describe a version of the admissions process that simply doesn’t apply to them.
At many top U.S. universities, international admissions operate under a different set of constraints than domestic admissions—constraints tied to funding, enrollment caps, institutional priorities, and yield assumptions that don’t show up in headline statistics. The result is that the acceptance rate most families see is often the least informative number in the entire decision-making process.
This isn’t about hidden rules or unfair treatment. It’s about structure.
In this article, I’m going to walk through how international acceptance rates actually compare to overall undergraduate acceptance rates at the top 30 U.S. universities for the 2025–2026 admissions cycle—and why the gap between those numbers matters far more than either number on its own.
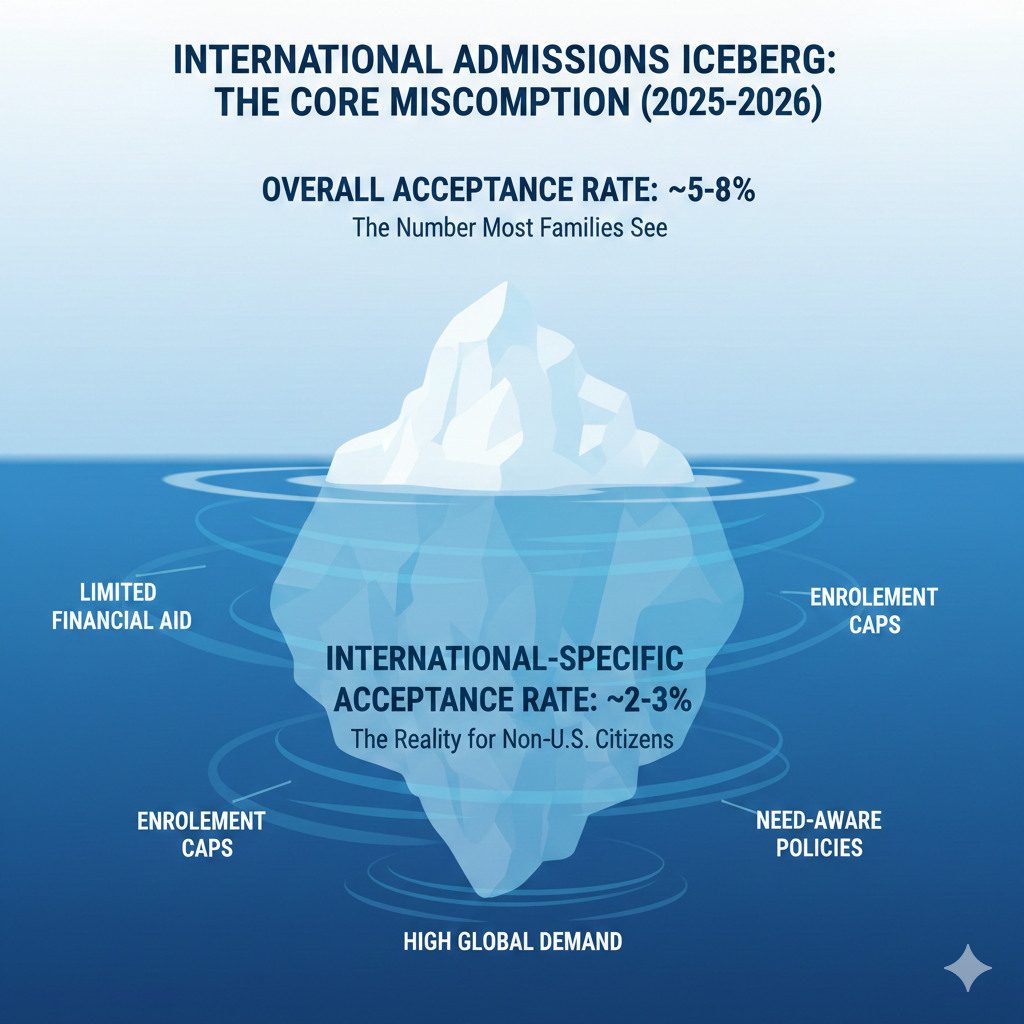
The Core Misconception
One Acceptance Rate Cannot Describe Two Admissions Systems
The biggest mistake I see families make is assuming that an acceptance rate applies equally to everyone.
It doesn’t.
Most published acceptance rates combine domestic and international applicants into a single figure. That blended number may be useful for understanding overall selectivity, but it often hides how admissions decisions are actually made for international students.
At many elite universities, international applicants are evaluated within a more constrained framework, shaped by factors such as:
- Limited funding availability for non-U.S. citizens
- Need-aware admissions policies for international students
- Enrollment targets that cap the size of the international cohort
- Extremely high global demand driven by brand recognition
Put simply: international applicants are often competing in a smaller, tighter pool.
When you separate the data, a consistent pattern emerges:
International acceptance rates are frequently lower than overall acceptance rates—sometimes significantly so—even at the same school, in the same year.
That doesn’t mean these universities are unfriendly to international students. Many value international perspectives deeply and enroll students from all over the world.
But it does mean that international admissions is shaped by constraints that domestic admissions is not.
And if you don’t account for those constraints when interpreting acceptance rates, it’s very easy to misjudge both risk and opportunity.
The Data
Overall vs. International Acceptance Rates (Top 30, 2025)
The table below contrasts:
- Overall undergraduate acceptance rates (from Common Data Set / institutional reporting aligned with U.S. News methodology)
- International acceptance rates, where published, using the College Transitions International Admission Dataverse
- Percentage of international undergraduates enrolled, drawn from Fortuna Admissions, to provide enrollment context
Important note: Percent international enrollment reflects who enrolls, not who is admitted. High international enrollment does not imply easier admission for international applicants.
Table 1: Acceptance Rates and International Enrollment Context
| University | Overall UG Acceptance Rate | International Acceptance Rate | % International Undergraduates |
| Princeton | ~4–5% | ~2% | ~12% |
| MIT | ~4% | Not reported | ~29% |
| Harvard | ~3–4% | ~2% | ~16% |
| Stanford | ~4% | ~4% | ~23% |
| Yale | ~4–5% | Not reported | ~12% |
| Caltech | ~3–4% | Not reported | ~30% |
| Duke | ~5% | ~4% | ~13% |
| Johns Hopkins | ~7–8% | ~5% | ~20% |
| Northwestern | ~7% | Not reported | ~17% |
| Penn | ~5–6% | ~3% | ~15% |
| Cornell | ~8–9% | ~3% | ~10% |
| UChicago | ~5–6% | Not reported | ~13% |
| Brown | ~5% | ~4% | ~14% |
| Columbia | ~4% | ~2% | ~16% |
| Dartmouth | ~5–6% | Not reported | ~12% |
| UCLA | ~9–11% | ~6% | ~8% |
| UC Berkeley | ~11–14% | ~3% | ~9% |
| Notre Dame | ~9–11% | ~7% | ~11% |
| Rice | ~8–9% | ~4% | ~14% |
| Vanderbilt | ~5–7% | ~4% | ~14% |
| Carnegie Mellon | ~11% | ~11% | ~21% |
| Michigan | ~15–18% | Not reported | ~15% |
| Washington University in St. Louis | ~11–14% | ~7% | ~18% |
| Emory | ~11–15% | ~6% | ~18% |
| Georgetown | ~12% | ~8% | ~8% |
| University of Virginia | ~15–21% | ~10% | ~7% |
| UNC Chapel Hill | ~15–18% | ~14% | ~6% |
| USC | ~10–12% | Not reported | ~24% |
| UC San Diego | ~24–30% | ~22% | ~11% |
| NYU | ~8–13% | ~8% | ~27% |
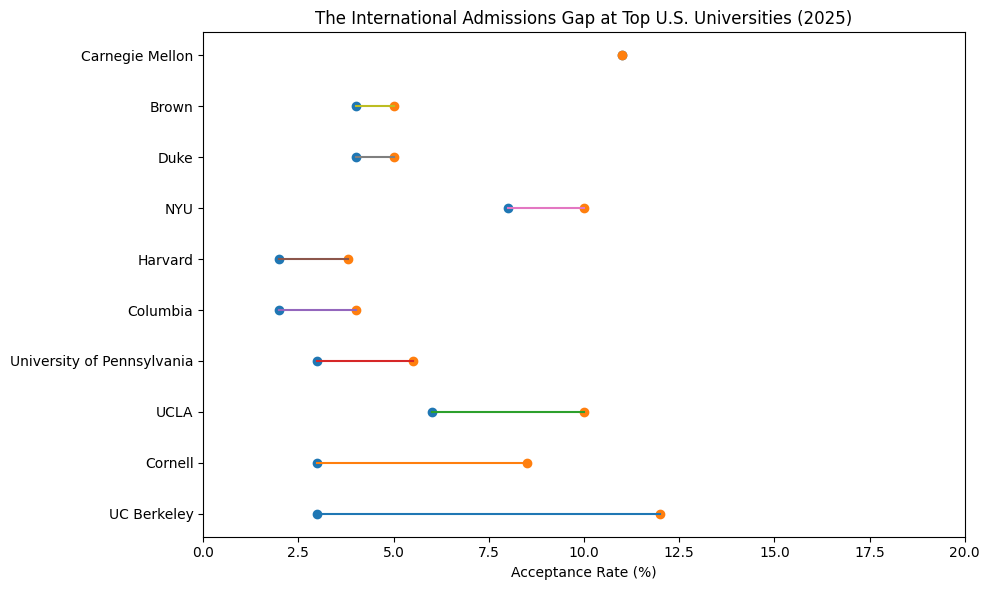
Looking at acceptance rates side by side makes the pattern clear. At many top universities, international applicants face a very different level of selectivity than the headline numbers suggest. The chart below highlights where that gap is widest—and where it is surprisingly small.
The International Admissions Gap at Top U.S. Universities (2025)
This chart compares overall undergraduate acceptance rates with published international acceptance rates at selected top U.S. universities. The distance between dots reflects how differently international applicants experience admissions selectivity relative to the headline acceptance rate.
What the Numbers Actually Show
Three Patterns International Applicants Should Actually Pay Attention To
Once you stop treating acceptance rates as a single, all-purpose truth and start comparing them side by side, a few patterns become hard to ignore.
They’re not subtle. And they’re far more useful than any individual percentage.
Pattern 1: International Acceptance Is Often More Selective Than It Looks
At many elite private universities — including Harvard, Princeton, Columbia, Penn, and Cornell — international acceptance rates are meaningfully lower than already-low overall acceptance rates.
This catches families off guard, especially when a school’s headline admit rate is already in single digits. The assumption is often: it’s hard for everyone, but at least it’s equally hard.
In practice, that’s rarely true.
For international applicants, this typically means:
- Fewer seats to compete for
- Financial considerations playing a more explicit role
- A much narrower margin for error
Strong grades and test scores are table stakes. They are not differentiators.
When families rely too heavily on headline acceptance rates, this gap can create a false sense of probability — not optimism exactly, but misplaced confidence that the odds are “about the same.”
They usually aren’t.
Pattern 2: High International Enrollment Does Not Mean Easier Admission
This is one of the most persistent misconceptions I see.
Some universities enroll very large international student populations — NYU, Stanford, MIT, Caltech, and Carnegie Mellon among them. Families often look at those numbers and assume these schools must be more open to international applicants.
They’re not.
What these institutions tend to have is exceptionally strong international yield. In other words, when they admit international students, those students are very likely to enroll. That allows the university to maintain a large international presence without lowering the bar for admission.
It’s a subtle but important distinction.
High international enrollment usually reflects:
- Global brand pull
- Concentrated demand in STEM, business, and tech-aligned fields
- Confidence that admitted students will say yes
It does not automatically reflect higher international acceptance rates.
Carnegie Mellon is a useful outlier here, where international and overall acceptance rates are roughly aligned — though even there, outcomes vary widely by college and major.
Pattern 3: Public Flagships Operate Under Constraints the Numbers Don’t Show
Public universities often appear more accessible at first glance.
Schools like UCLA, UC Berkeley, UVA, UNC, and UC San Diego frequently post higher overall acceptance rates — and in some cases, higher international acceptance rates — than elite private universities.
That can make them look like safer options.
But public flagships operate under a different set of pressures:
- State residency priorities
- Fixed funding models
- Explicit or implicit caps on non-resident enrollment
The result is that even when acceptance rates look comparatively favorable, seat availability for international students remains limited.
Public universities can absolutely belong on an international student’s list — especially when there’s strong academic and financial alignment. They just shouldn’t be treated as automatic fallbacks based on acceptance rates alone.
The throughline
Across all three patterns, the lesson is the same: acceptance rates aren’t lies — but they are incomplete truths.
For international applicants, what matters isn’t just how selective a school is, but how that selectivity is distributed — and under what constraints.
That distinction is what separates realistic college lists from frustrating outcomes.
School Spotlights & Case Studies
How International Admissions Actually Plays Out at Different Types of Universities
One of the easiest mistakes families make is treating the top 30 universities as interchangeable — as if the same acceptance-rate logic applies everywhere.
It doesn’t.
Different institutions operate under very different international admissions models. Looking at a few representative cases makes the patterns — and the tradeoffs — much clearer.
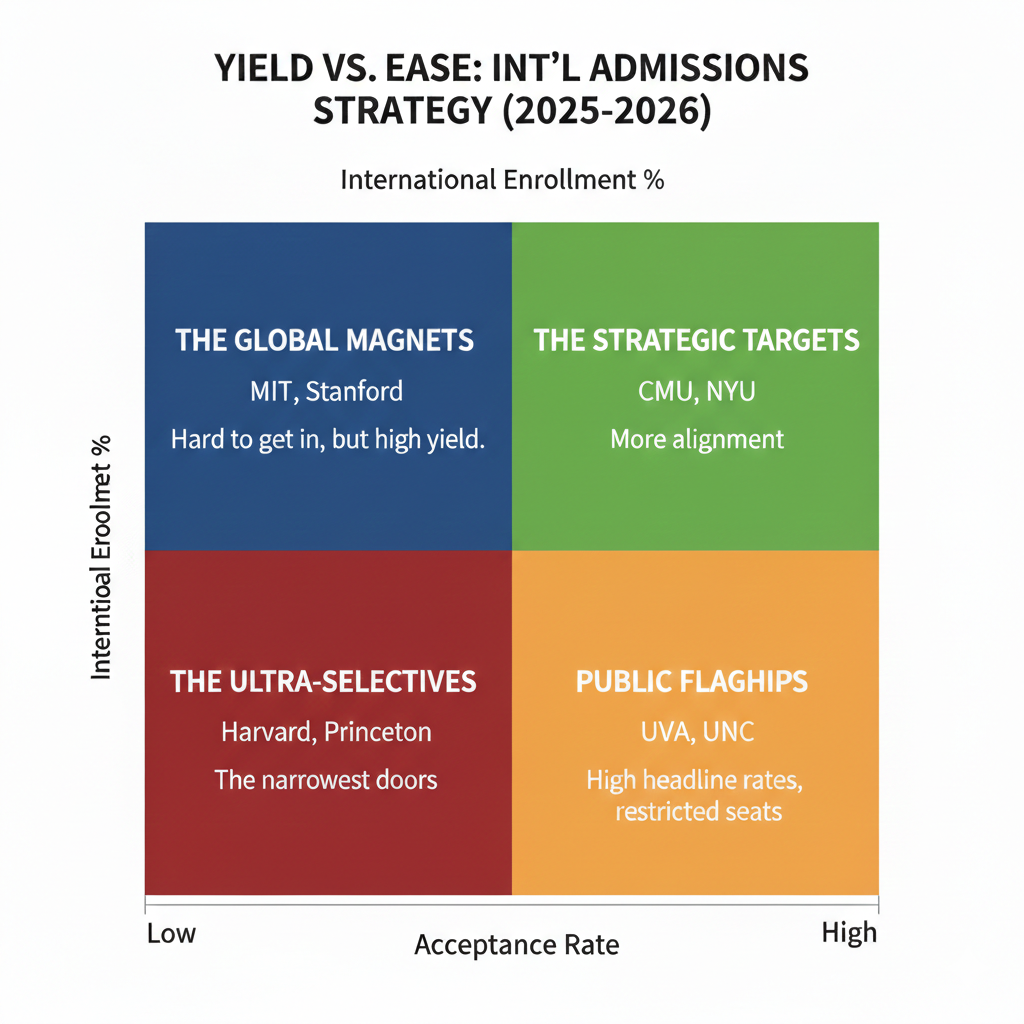
Case Study 1: Ultra-Selective Privates
Harvard University, Princeton University, Columbia University
These are the schools families most often cite when they say, “We know it’s a reach, but we still want to try.”
That instinct is understandable. These institutions are globally recognizable, deeply resourced, and genuinely committed to enrolling international students.
They are also operating with extreme scarcity.
Here’s what the data tends to show:
- Overall acceptance rates hovering around 3–5%
- International acceptance rates (where published) closer to ~2%
- International enrollment typically in the low-to-mid teens
What’s going on behind the scenes is not mysterious, but it is easy to underestimate. These universities receive enormous international applicant pools, are often need-aware for non-U.S. citizens, and maintain relatively stable international enrollment targets year over year.
The result is a compressed funnel: many exceptional international applicants competing for very few seats.
How I frame this for families:
These schools should be treated as true reaches for almost everyone — including students with near-perfect academic profiles. A rejection here says far more about institutional limits than applicant quality.
Case Study 2: Global Magnets: High International Presence, High Bar
New York University, Stanford University, Massachusetts Institute of Technology
These schools often confuse families in a different way.
They enroll a lot of international students. NYU, MIT, and Stanford routinely report international undergraduate populations north of 20%. The natural assumption is that these schools must be more open to international applicants.
They aren’t.
What they have is exceptionally strong international yield. When these institutions admit international students, those students are very likely to enroll. That allows the university to maintain a large international footprint without admitting more students overall.
This is especially true in high-demand fields like engineering, computer science, and business-adjacent majors.
The key distinction:
High international enrollment reflects who says yes, not who gets admitted.
These schools can be outstanding options for international applicants with clear academic direction and strong alignment — but they should not be interpreted as safer bets simply because the campus feels globally diverse.
Case Study 3: A Genuine Outlier: When the Numbers Actually Line Up
Carnegie Mellon University
Carnegie Mellon is one of the few institutions in this group where the data looks refreshingly straightforward.
Overall acceptance rate: ~11%
International acceptance rate: ~11%
International enrollment: ~21%
This alignment doesn’t make CMU “easy.” Admission is still highly competitive, especially in technical fields. But it does suggest that international applicants are not being filtered out at the institutional level in the same way they are elsewhere.
There’s an important caveat here: outcomes vary dramatically by college and major. Engineering, computer science, and fine arts each operate under different dynamics.
Why CMU matters in this conversation:
It’s proof that large gaps between overall and international acceptance rates are not inevitable. For the right student, CMU can function as a strategic high reach or upper target — not just a lottery ticket.
Case Study 4: Public Flagships: Opportunity With Conditions
University of California, Los Angeles, University of California, Berkeley, University of Virginia
Public universities often look more accessible on paper. Acceptance rates are higher. International acceptance rates, where published, can appear comparatively generous.
But public flagships operate under constraints that acceptance-rate tables don’t capture:
- State residency priorities
- Fixed funding models
- Explicit or implicit caps on non-resident enrollment
That’s why you’ll often see a disconnect between acceptance rates and actual international enrollment.
How I frame public universities for international families:
They can be excellent options — especially with strong academic and financial fit — but they should be approached intentionally. They are not automatic backups, and they shouldn’t be chosen based on acceptance rates alone.
The Common Thread
Across all of these cases, the takeaway is the same: international admissions is not just about selectivity — it’s about structure.
Once you understand how a university manages international enrollment in practice, the acceptance-rate numbers start to make a lot more sense.
And that’s when list-building becomes strategy instead of guesswork.
What This Means for Your College List
How International Students Should Actually Use Acceptance-Rate Data

How International Students Should Actually Use Acceptance-Rate Data
Let’s be clear about something upfront: acceptance rates are not useless.
They’re just wildly misused.
For international students, the mistake isn’t looking at acceptance rates — it’s treating them as fixed truths rather than institutional signals. Once you understand that, list-building starts to feel less emotional and a lot more strategic.
Here’s how I’d actually use this data.
1️⃣ Stop Using Overall Acceptance Rates as a Stand-Alone Metric
If you’re an international applicant, the overall acceptance rate is the least precise number in the room.
It blends domestic and international applicants into a single statistic and quietly ignores:
- funding constraints,
- need-aware policies,
- and enrollment caps that apply almost exclusively to non-U.S. citizens.
That’s why a school with a “9% acceptance rate” can feel attainable — while the international admit rate sits much closer to 3–4%.
What matters more than the number itself is the gap.
A small gap suggests international applicants are evaluated similarly to domestic ones.
A large gap tells you the institution is operating with tighter constraints — no matter how friendly the headline sounds.
2️⃣ Build Lists Around Institutional Behavior, Not Rankings
Rankings are easy to find. Admissions behavior is not — which is why it matters more.
Strong international college lists are built by asking:
- How many international students does this school actually enroll?
- Are international acceptance rates disproportionately lower than overall rates?
- Does this institution consistently enroll international students in my academic area?
Two schools ranked ten places apart can operate under completely different admissions models. One might quietly admit and enroll international students year after year. The other might admit very few — but dominate headlines.
Strategy beats prestige when it comes to outcomes.
3️⃣ Don’t Confuse “Global Campus” With “Accessible Admission”
This is one of the most common misreads I see.
A campus that feels international is not necessarily more open to international applicants. High international enrollment often reflects strong yield — meaning admitted students are very likely to enroll — not a lower admissions bar.
If a school is globally famous, highly specialized, and located in a major city, demand is almost always far ahead of supply.
In other words: diversity on campus does not equal generosity in admissions.
4️⃣ Treat Public Universities as Strategic Options — Not Safety Nets
Public flagships deserve more nuance than they usually get.
Yes, acceptance rates are often higher. Yes, some international admit rates look comparatively favorable. But state residency priorities and non-resident enrollment limits still shape who actually gets a seat.
Public universities can be excellent choices for international students — particularly those with strong academic alignment and a clear financial plan — but they should be chosen deliberately, not assumed to be backups.
If a school is publicly funded, seat availability matters more than percentages.
5️⃣ Take “Surprising” Schools Seriously
Some universities are chronically under-considered by international families — not because they lack quality, but because they don’t dominate global rankings conversations.
In practice, these schools often offer:
- strong international enrollment,
- clearer admissions patterns,
- and excellent academic outcomes.
Depending on fit, the following institutions frequently deserve closer attention:
- Rice University — small size, strong STEM access, and balanced international outcomes
- University of Notre Dame — stable enrollment, clear institutional mission, strong outcomes
- Emory University — higher international enrollment and pre-professional strength
- Washington University in St. Louis — flexible academics and consistent global recruitment
- Georgetown University — global focus and strength in policy, international affairs, and economics
These aren’t “easier” schools. They’re just often more predictable — which matters.
The Bottom Line
The most effective international college lists are not built around the lowest percentage.
They’re built around:
- how institutions actually admit international students,
- how many they enroll,
- and whether those patterns align with a student’s academic goals, financial reality, and long-term plans.
Acceptance rates don’t tell you where you belong. They tell you how carefully you need to read the system.
That shift — from chasing numbers to understanding behavior — is where smart strategy begins.
Final Perspective
From Numbers to Strategy
For international applicants, acceptance rates are not promises — and they’re not verdicts.
They’re signals. And like most signals in college admissions, they’re shaped less by individual merit and more by institutional realities: funding models, enrollment targets, yield assumptions, and global demand that far outpaces supply.
That’s why headline acceptance rates can be so misleading. They flatten two very different admissions systems into a single number — and invite families to draw conclusions that don’t actually hold up.
The international students who navigate this process most successfully don’t chase the lowest percentage or the loudest name. They pay attention to:
- how universities actually admit international students,
- how many they enroll,
- and where those patterns align with their academic goals, financial situation, and long-term plans.
This isn’t about being pessimistic. It’s about being precise.
Once you start reading admissions data as behavior — not marketing — list-building becomes calmer, clearer, and far more strategic.
And that’s the real advantage.